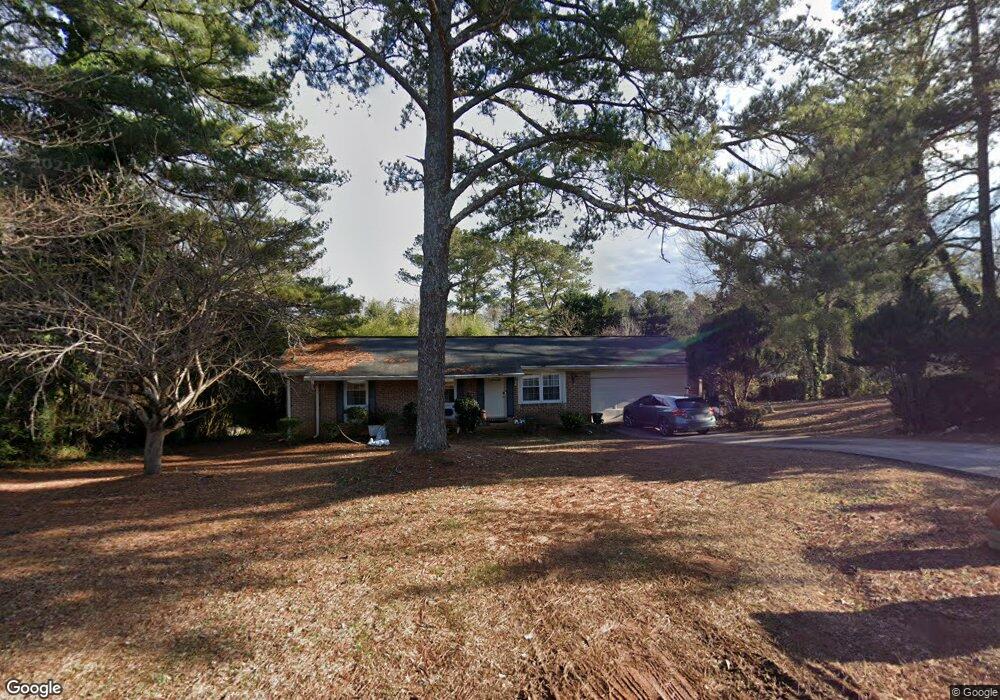
401 Pineland Rd SW Unit 1 Mableton, GA 30126
Estimated Value: $192,000 - $280,000
3
Beds
2
Baths
1,075
Sq Ft
$221/Sq Ft
Est. Value
About This Home
This home is located at 401 Pineland Rd SW Unit 1, Mableton, GA 30126 and is currently estimated at $237,153, approximately $220 per square foot. 401 Pineland Rd SW Unit 1 is a home located in Cobb County with nearby schools including Mableton Elementary School, Floyd Middle School, and South Cobb High School.
Ownership History
Date
Name
Owned For
Owner Type
Purchase Details
Closed on
Jun 17, 2005
Sold by
Miceli Paul
Bought by
Unto Freeport Title & Guaranty I
Current Estimated Value
Home Financials for this Owner
Home Financials are based on the most recent Mortgage that was taken out on this home.
Original Mortgage
$106,400
Outstanding Balance
$55,121
Interest Rate
5.74%
Mortgage Type
New Conventional
Estimated Equity
$182,032
Purchase Details
Closed on
May 25, 2005
Sold by
Creative Prop Ventures Inc
Bought by
Miceli Paul
Home Financials for this Owner
Home Financials are based on the most recent Mortgage that was taken out on this home.
Original Mortgage
$106,400
Outstanding Balance
$55,121
Interest Rate
5.74%
Mortgage Type
New Conventional
Estimated Equity
$182,032
Purchase Details
Closed on
Apr 14, 2004
Sold by
Jenkins Stevie and Jenkins Jeanette
Bought by
Creative Property Ventures Inc
Home Financials for this Owner
Home Financials are based on the most recent Mortgage that was taken out on this home.
Original Mortgage
$100,000
Interest Rate
5.38%
Purchase Details
Closed on
Dec 1, 1995
Sold by
Westminster Props Inc
Bought by
Jenkins Stevie
Create a Home Valuation Report for This Property
The Home Valuation Report is an in-depth analysis detailing your home's value as well as a comparison with similar homes in the area
Home Values in the Area
Average Home Value in this Area
Purchase History
| Date | Buyer | Sale Price | Title Company |
|---|---|---|---|
| Unto Freeport Title & Guaranty I | -- | -- | |
| Miceli Paul | -- | -- | |
| Creative Property Ventures Inc | $85,000 | -- | |
| Jenkins Stevie | $74,300 | -- |
Source: Public Records
Mortgage History
| Date | Status | Borrower | Loan Amount |
|---|---|---|---|
| Open | Miceli Paul | $106,400 | |
| Previous Owner | Creative Property Ventures Inc | $100,000 | |
| Closed | Jenkins Stevie | $0 |
Source: Public Records
Tax History Compared to Growth
Tax History
| Year | Tax Paid | Tax Assessment Tax Assessment Total Assessment is a certain percentage of the fair market value that is determined by local assessors to be the total taxable value of land and additions on the property. | Land | Improvement |
|---|---|---|---|---|
| 2025 | $2,667 | $88,524 | $24,000 | $64,524 |
| 2024 | $2,669 | $88,524 | $24,000 | $64,524 |
| 2023 | $2,820 | $93,528 | $18,000 | $75,528 |
| 2022 | $1,976 | $65,120 | $10,000 | $55,120 |
| 2021 | $1,976 | $65,120 | $10,000 | $55,120 |
| 2020 | $1,580 | $52,048 | $10,000 | $42,048 |
| 2019 | $1,580 | $52,048 | $10,000 | $42,048 |
| 2018 | $927 | $30,548 | $8,000 | $22,548 |
| 2017 | $878 | $30,548 | $8,000 | $22,548 |
| 2016 | $662 | $23,032 | $4,400 | $18,632 |
| 2015 | $505 | $17,144 | $4,400 | $12,744 |
| 2014 | $509 | $17,144 | $0 | $0 |
Source: Public Records
Map
Nearby Homes
- 414 Landers Dr SW Unit 1
- 5287 Maple Valley Rd SW
- 470 Pineland Rd SW
- 187 Fontaine Rd SW
- 581 Maran Ln SW
- 647 Shannon Green Cir SW
- 511 Fontaine Rd SW
- 4925 Olaughlin Ct SW
- 640 Monticello Dr SW
- 195 County Cork Dr SW
- 680 Sundial Ln
- 684 Sundial Ln
- 1729 Hyssop Blvd
- 237 Barbara Ln
- 26 Flint Ridge Dr SE
- 4766 Mckee Ct SW
- 4910 Collins Lake Dr
- 5341 Old Floyd Rd SW
- 875 Joseph Club Dr SW
- 70 Driskell Ave SW
- 381 Pineland Rd SW
- 411 Pineland Rd SW
- 402 Pineland Rd SW
- 371 Pineland Rd SW Unit 371
- 371 Pineland Rd SW Unit 1
- 371 Pineland Rd SW
- 438 Landers Dr SW
- 450 Landers Dr SW
- 410 Pineland Rd SW
- 392 Pineland Rd SW
- 382 Pineland Rd SW
- 466 Landers Dr SW
- 372 Pineland Rd SW Unit 1
- 420 Pineland Rd SW Unit 1
- 426 Landers Dr SW
- 361 Pineland Rd SW
- 362 Pineland Rd SW
- 430 Pineland Rd SW
- 453 Landers Dr SW
- 351 Pineland Rd SW