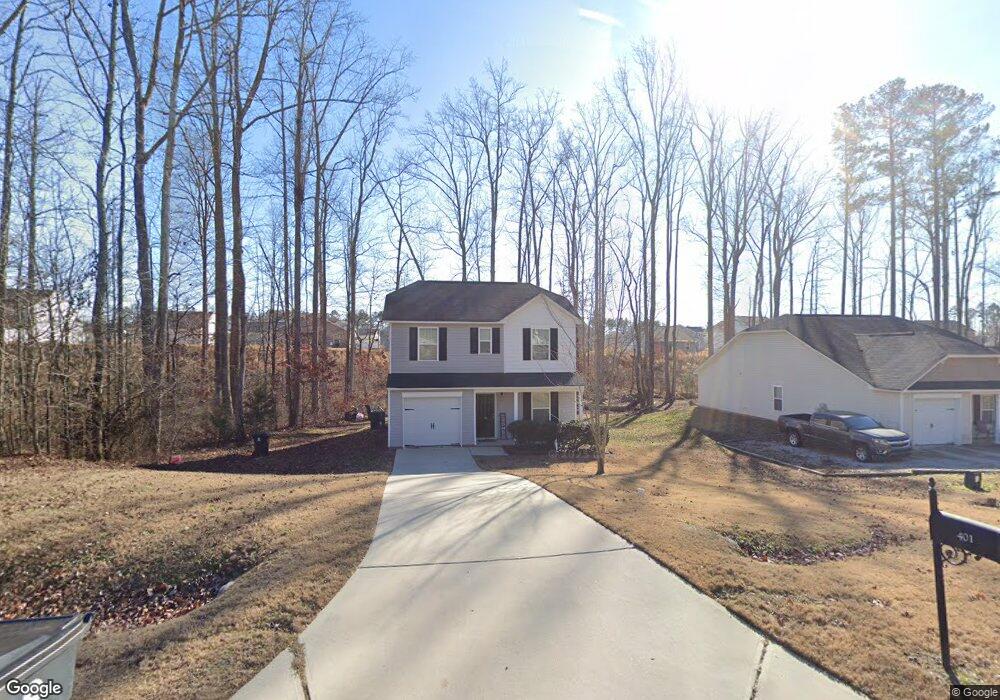
401 Polly Dr Oxford, NC 27565
Estimated Value: $277,125 - $315,000
3
Beds
3
Baths
1,453
Sq Ft
$206/Sq Ft
Est. Value
About This Home
This home is located at 401 Polly Dr, Oxford, NC 27565 and is currently estimated at $299,531, approximately $206 per square foot. 401 Polly Dr is a home located in Granville County with nearby schools including Stovall-Shaw Elementary School, Northern Granville Middle School, and Granville Central High School.
Ownership History
Date
Name
Owned For
Owner Type
Purchase Details
Closed on
Mar 20, 2018
Sold by
Sauceda Alden Omar and Lopez Lizet
Bought by
Kingsberry Elaine Blair
Current Estimated Value
Home Financials for this Owner
Home Financials are based on the most recent Mortgage that was taken out on this home.
Original Mortgage
$143,560
Outstanding Balance
$122,844
Interest Rate
4.32%
Mortgage Type
New Conventional
Estimated Equity
$176,687
Purchase Details
Closed on
Aug 21, 2017
Sold by
Wjh Llc
Bought by
Sauceda Alden Omar and Lopez Lizet
Home Financials for this Owner
Home Financials are based on the most recent Mortgage that was taken out on this home.
Original Mortgage
$140,640
Interest Rate
3.96%
Mortgage Type
New Conventional
Purchase Details
Closed on
Feb 12, 2009
Sold by
Bergen Custom Homes Inc
Bought by
North State Bank
Create a Home Valuation Report for This Property
The Home Valuation Report is an in-depth analysis detailing your home's value as well as a comparison with similar homes in the area
Home Values in the Area
Average Home Value in this Area
Purchase History
| Date | Buyer | Sale Price | Title Company |
|---|---|---|---|
| Kingsberry Elaine Blair | $157,500 | None Available | |
| Sauceda Alden Omar | $145,000 | None Available | |
| North State Bank | $20,000 | -- |
Source: Public Records
Mortgage History
| Date | Status | Borrower | Loan Amount |
|---|---|---|---|
| Open | Kingsberry Elaine Blair | $143,560 | |
| Previous Owner | Sauceda Alden Omar | $140,640 |
Source: Public Records
Tax History Compared to Growth
Tax History
| Year | Tax Paid | Tax Assessment Tax Assessment Total Assessment is a certain percentage of the fair market value that is determined by local assessors to be the total taxable value of land and additions on the property. | Land | Improvement |
|---|---|---|---|---|
| 2025 | $2,648 | $225,528 | $25,000 | $200,528 |
| 2024 | $2,648 | $225,528 | $25,000 | $200,528 |
| 2023 | $2,646 | $146,096 | $20,000 | $126,096 |
| 2022 | $2,253 | $146,096 | $20,000 | $126,096 |
| 2021 | $2,162 | $146,096 | $20,000 | $126,096 |
| 2020 | $2,162 | $146,096 | $20,000 | $126,096 |
| 2019 | $2,162 | $146,096 | $20,000 | $126,096 |
| 2018 | $2,162 | $18,000 | $18,000 | $0 |
| 2016 | $274 | $18,000 | $18,000 | $0 |
| 2015 | $265 | $18,000 | $18,000 | $0 |
| 2014 | $265 | $18,000 | $18,000 | $0 |
| 2013 | -- | $18,000 | $18,000 | $0 |
Source: Public Records
Map
Nearby Homes
- 504 Rhino Bend
- 102 Cultivar St
- 103 Scoville St
- 501 Benton Dr
- 101 Flue Ct
- 111 Rhino Bend
- 109 Rhino Bend
- 100 Flue Ct
- 107 Flue Ct
- 903 Rhino Bend
- 201 Benton Dr
- Blanco Plan at The Meadows at Oxford
- Carolina Plan at The Meadows at Oxford
- Burke Plan at The Meadows at Oxford
- Camden Plan at The Meadows at Oxford
- Birch Plan at The Meadows at Oxford
- 900 Rhino Bend
- 104 Flue Ct
- 1009 Rhino Bend
- 1017 Rhino Bend