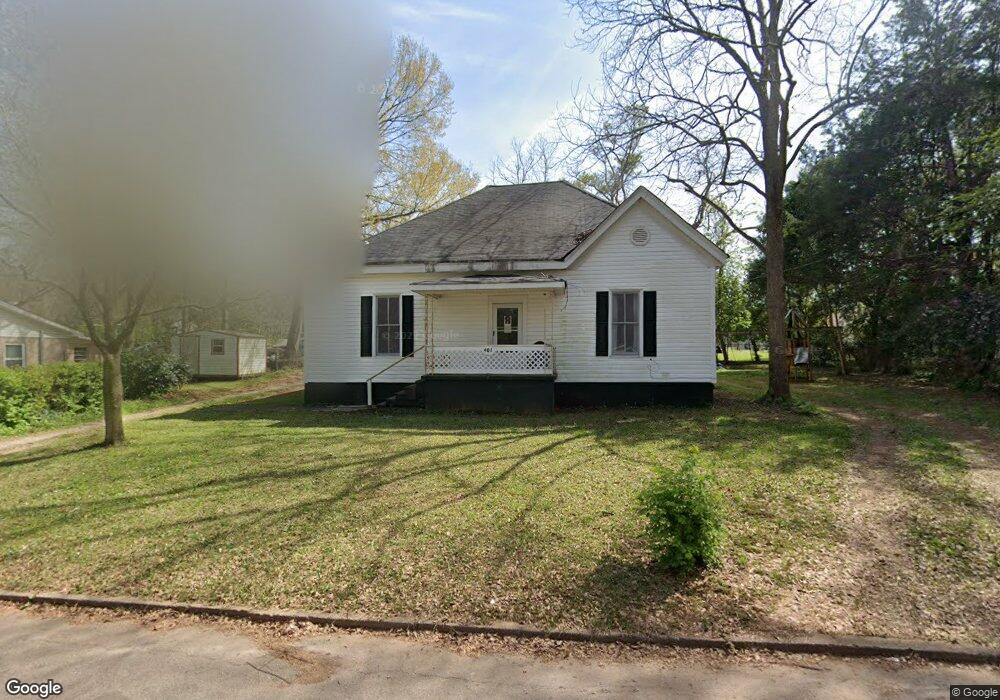
401 Ridge St Lagrange, GA 30240
Estimated Value: $168,000 - $1,174,537
3
Beds
1
Bath
1,848
Sq Ft
$237/Sq Ft
Est. Value
About This Home
This home is located at 401 Ridge St, Lagrange, GA 30240 and is currently estimated at $437,134, approximately $236 per square foot. 401 Ridge St is a home with nearby schools including Ethel W. Kight Elementary School, Hollis Hand Elementary School, and Franklin Forest Elementary School.
Ownership History
Date
Name
Owned For
Owner Type
Purchase Details
Closed on
Jun 1, 2021
Sold by
Stribling Ty
Bought by
T Squared 1 Llc
Current Estimated Value
Purchase Details
Closed on
Aug 31, 2010
Sold by
Matthews James R
Bought by
Stribling Ty
Purchase Details
Closed on
Oct 31, 2008
Sold by
Jackson Janice Faye
Bought by
Matthews James R
Purchase Details
Closed on
Apr 25, 2006
Sold by
Matthews James Ralph
Bought by
Matthews James Ralph and Jackson Janice Faye Co
Purchase Details
Closed on
Aug 7, 1979
Sold by
City Of Lagrange
Bought by
Ralph Matthews J
Purchase Details
Closed on
Jan 1, 1973
Sold by
Howard Ralph Wallace
Bought by
City Of Lagrange
Purchase Details
Closed on
Jan 1, 1972
Sold by
Matthews J Ralph
Bought by
Howard Ralph Wallace
Purchase Details
Closed on
Jan 1, 1971
Sold by
Bishop James Hubert
Bought by
Matthews J Ralph
Purchase Details
Closed on
Feb 1, 1959
Sold by
Grovenstien Mrs H F
Bought by
Bishop James Hubert
Create a Home Valuation Report for This Property
The Home Valuation Report is an in-depth analysis detailing your home's value as well as a comparison with similar homes in the area
Purchase History
| Date | Buyer | Sale Price | Title Company |
|---|---|---|---|
| T Squared 1 Llc | -- | -- | |
| Stribling Ty | $495,000 | -- | |
| Matthews James R | -- | -- | |
| Matthews James Ralph | -- | -- | |
| Ralph Matthews J | -- | -- | |
| City Of Lagrange | -- | -- | |
| Howard Ralph Wallace | -- | -- | |
| Matthews J Ralph | $10,000 | -- | |
| Bishop James Hubert | -- | -- |
Source: Public Records
Tax History
| Year | Tax Paid | Tax Assessment Tax Assessment Total Assessment is a certain percentage of the fair market value that is determined by local assessors to be the total taxable value of land and additions on the property. | Land | Improvement |
|---|---|---|---|---|
| 2025 | $1,192 | $43,720 | $4,000 | $39,720 |
| 2024 | $1,041 | $38,160 | $4,000 | $34,160 |
| 2023 | $770 | $28,240 | $4,000 | $24,240 |
| 2022 | $740 | $26,520 | $4,000 | $22,520 |
| 2021 | $414 | $13,720 | $4,000 | $9,720 |
| 2020 | $414 | $13,720 | $4,000 | $9,720 |
| 2019 | $353 | $11,720 | $3,200 | $8,520 |
| 2018 | $353 | $11,720 | $3,200 | $8,520 |
| 2017 | $353 | $11,720 | $3,200 | $8,520 |
| 2016 | $339 | $11,230 | $3,000 | $8,230 |
| 2015 | $339 | $11,230 | $3,000 | $8,230 |
| 2014 | $340 | $11,230 | $3,000 | $8,230 |
| 2013 | -- | $17,732 | $4,000 | $13,732 |
Source: Public Records
Map
Nearby Homes
- 207 Wilkes St
- 304 Boulevard
- 416 Park Ave
- 421 College Ave
- 208 Boulevard
- 600 Park Ave
- 119 College Ave
- 206 Peachtree St
- 509 S Lewis St
- 505 S Lewis St
- 405 W Broome St Unit 2
- 405 W Broome St Unit 3
- 405 W Broome St Unit 4
- 405 W Broome St Unit 1
- 405 W Broome St Unit 5
- 200 Peachtree St
- 812 Elm St
- 914 Todd St
- 606 Poplar St
- 217 Jefferson St
Your Personal Tour Guide
Ask me questions while you tour the home.