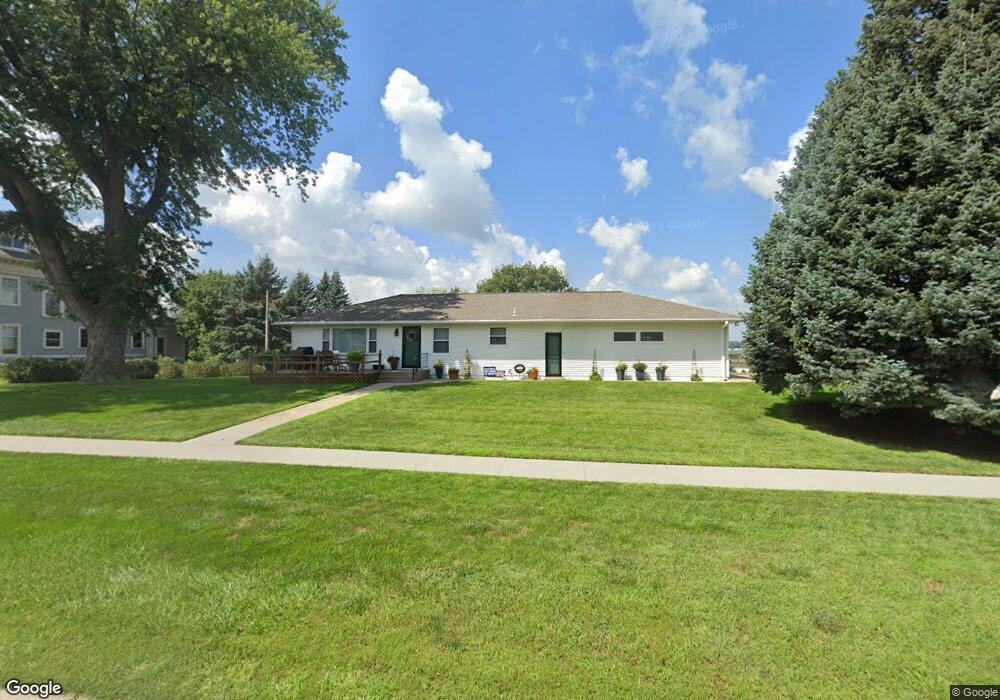
401 S 3rd St Dunlap, IA 51529
Estimated Value: $135,000 - $232,000
3
Beds
2
Baths
1,176
Sq Ft
$154/Sq Ft
Est. Value
About This Home
This home is located at 401 S 3rd St, Dunlap, IA 51529 and is currently estimated at $181,001, approximately $153 per square foot. 401 S 3rd St is a home located in Harrison County with nearby schools including Boyer Valley Elementary School and Boyer Valley Middle/High School.
Ownership History
Date
Name
Owned For
Owner Type
Purchase Details
Closed on
Jul 20, 2021
Sold by
Carter Brian L and Carter Cindy J
Bought by
Corey Barbara L
Current Estimated Value
Home Financials for this Owner
Home Financials are based on the most recent Mortgage that was taken out on this home.
Original Mortgage
$167,500
Outstanding Balance
$139,614
Interest Rate
2.93%
Mortgage Type
New Conventional
Estimated Equity
$41,387
Create a Home Valuation Report for This Property
The Home Valuation Report is an in-depth analysis detailing your home's value as well as a comparison with similar homes in the area
Purchase History
| Date | Buyer | Sale Price | Title Company |
|---|---|---|---|
| Corey Barbara L | $188,000 | None Listed On Document |
Source: Public Records
Mortgage History
| Date | Status | Borrower | Loan Amount |
|---|---|---|---|
| Open | Corey Barbara L | $167,500 |
Source: Public Records
Tax History
| Year | Tax Paid | Tax Assessment Tax Assessment Total Assessment is a certain percentage of the fair market value that is determined by local assessors to be the total taxable value of land and additions on the property. | Land | Improvement |
|---|---|---|---|---|
| 2025 | $2,412 | $147,420 | $6,770 | $140,650 |
| 2024 | $2,412 | $133,950 | $6,770 | $127,180 |
| 2023 | $2,536 | $133,950 | $6,770 | $127,180 |
| 2022 | $2,284 | $128,417 | $6,768 | $121,649 |
| 2021 | $2,284 | $128,417 | $6,768 | $121,649 |
| 2020 | $2,010 | $108,215 | $6,768 | $101,447 |
| 2019 | $2,336 | $108,215 | $6,768 | $101,447 |
| 2018 | $2,320 | $117,034 | $0 | $0 |
| 2017 | $2,320 | $117,034 | $0 | $0 |
| 2016 | $2,542 | $117,034 | $0 | $0 |
| 2015 | $2,542 | $105,436 | $0 | $0 |
| 2014 | $2,124 | $105,436 | $0 | $0 |
Source: Public Records
Map
Nearby Homes
- 202 Y St
- 1403 Eaton St
- TBD 150th St
- 211 Brookview Dr
- 47 6th St
- 42 6th St
- 406 Weare St
- 102 Bluegrass Ln
- 101 Bluegrass Ln
- 907 Harvest Hills Dr
- 106 Bluegrass Ln
- 905 Harvest Hills Dr
- 903 Harvest Hills Dr
- 111 Ridgeline Rd
- 906 Harvest Hills Dr
- 109 Bluegrass Ln
- 904 Harvest Hills Dr
- 902 Harvest Hills Dr
- 809 Harvest Hills Dr
- 118 Ridgeline Rd
Your Personal Tour Guide
Ask me questions while you tour the home.