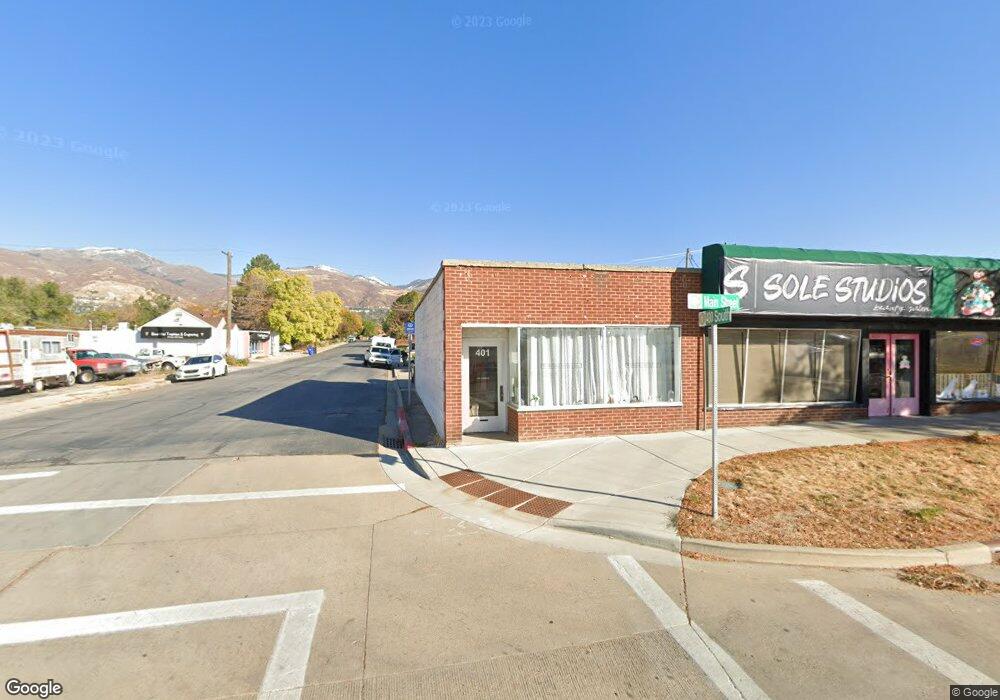
401 S Main St Bountiful, UT 84010
Estimated Value: $885,947
Studio
--
Bath
5,720
Sq Ft
$155/Sq Ft
Est. Value
About This Home
This home is located at 401 S Main St, Bountiful, UT 84010 and is currently estimated at $885,947, approximately $154 per square foot. 401 S Main St is a home located in Davis County with nearby schools including Holbrook Elementary School, Millcreek Junior High School, and Bountiful High School.
Ownership History
Date
Name
Owned For
Owner Type
Purchase Details
Closed on
Jan 4, 2010
Sold by
Manning Robyn M
Bought by
Manning Robyn M
Current Estimated Value
Purchase Details
Closed on
Nov 15, 2004
Sold by
Morley Joyce P
Bought by
Manning Robyn M and Joyce P Morley Revocable Trust
Purchase Details
Closed on
Oct 1, 1997
Sold by
Parker Ray C and Parker Carma A
Bought by
Parker Ray C and Parker Carma A
Purchase Details
Closed on
Apr 26, 1996
Sold by
Morley Joyce P and Morley Arthur C
Bought by
Morley Joyce P
Create a Home Valuation Report for This Property
The Home Valuation Report is an in-depth analysis detailing your home's value as well as a comparison with similar homes in the area
Purchase History
| Date | Buyer | Sale Price | Title Company |
|---|---|---|---|
| Manning Robyn M | -- | None Available | |
| Manning Robyn M | -- | -- | |
| Parker Ray C | -- | -- | |
| Morley Joyce P | -- | -- |
Source: Public Records
Tax History
| Year | Tax Paid | Tax Assessment Tax Assessment Total Assessment is a certain percentage of the fair market value that is determined by local assessors to be the total taxable value of land and additions on the property. | Land | Improvement |
|---|---|---|---|---|
| 2025 | $4,559 | $451,313 | $175,561 | $275,752 |
| 2024 | $4,314 | $238,629 | $86,966 | $151,663 |
| 2023 | $4,193 | $230,723 | $79,059 | $151,663 |
| 2022 | $4,209 | $419,497 | $143,745 | $275,752 |
| 2021 | $4,659 | $391,329 | $115,577 | $275,752 |
| 2020 | $4,609 | $391,349 | $115,597 | $275,752 |
| 2019 | $4,720 | $391,349 | $115,597 | $275,752 |
| 2018 | $4,697 | $385,000 | $109,248 | $275,752 |
| 2016 | $4,769 | $385,000 | $109,248 | $275,752 |
| 2015 | $3,839 | $293,000 | $109,248 | $183,752 |
| 2014 | $1,595 | $293,000 | $109,248 | $183,752 |
| 2013 | -- | $293,000 | $109,248 | $183,752 |
Source: Public Records
Map
Nearby Homes
- 34 W 400 S
- 32 W 400 S
- 357 S 100 E
- 650 S Main St Unit 6206
- 650 S Main St Unit 9106
- 545 S 100 E
- 255 E 400 S
- 275 E Peach Ln S
- 323 Peach Ln
- 520 S Orchard Dr Unit 17
- 51 E 200 N Unit 3
- 55 E 200 N Unit 2
- 41 E 200 N Unit 6
- 49 E 200 N Unit 4
- 254 N Main St
- 256 N Main St
- 252 N Main St
- 75 N Peregrine Ln W Unit 8
- 285 E 1100 S
- 376 W 800 S
Your Personal Tour Guide
Ask me questions while you tour the home.