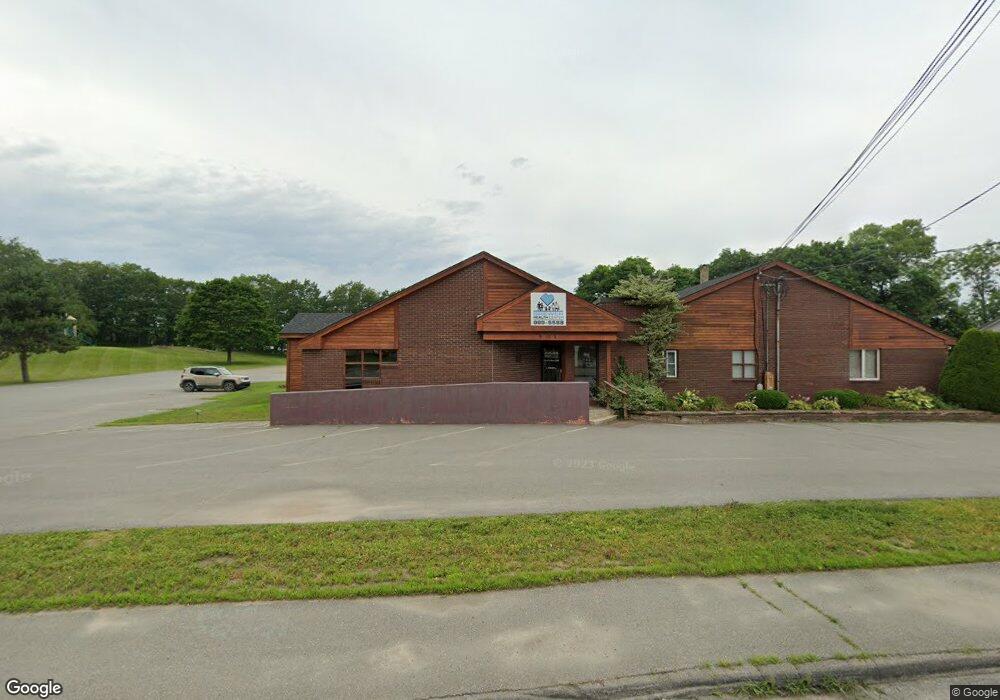
401 S Main St Brewer, ME 04412
--
Bed
--
Bath
5,339
Sq Ft
0.79
Acres
About This Home
This home is located at 401 S Main St, Brewer, ME 04412. 401 S Main St is a home located in Penobscot County with nearby schools including Brewer Community School, Brewer High School, and Calvary Chapel Christian School.
Ownership History
Date
Name
Owned For
Owner Type
Purchase Details
Closed on
Dec 26, 2022
Sold by
401 South Main Street Llc
Bought by
Ross Ft and Ross
Purchase Details
Closed on
Apr 5, 2011
Sold by
Ross Gary M and Lemon-Ross Colleen
Bought by
Ross Gary M and Lemon-Ross Colleen
Home Financials for this Owner
Home Financials are based on the most recent Mortgage that was taken out on this home.
Original Mortgage
$200,000
Interest Rate
5.04%
Mortgage Type
Commercial
Create a Home Valuation Report for This Property
The Home Valuation Report is an in-depth analysis detailing your home's value as well as a comparison with similar homes in the area
Home Values in the Area
Average Home Value in this Area
Purchase History
| Date | Buyer | Sale Price | Title Company |
|---|---|---|---|
| Ross Ft | -- | None Available | |
| Ross Ft | -- | None Available | |
| Ross Gary M | -- | -- | |
| 401 South Main St Llc | -- | -- | |
| Ross Gary M | -- | -- |
Source: Public Records
Mortgage History
| Date | Status | Borrower | Loan Amount |
|---|---|---|---|
| Previous Owner | 401 South Main St Llc | $200,000 | |
| Previous Owner | Ross Gary M | $0 |
Source: Public Records
Tax History Compared to Growth
Tax History
| Year | Tax Paid | Tax Assessment Tax Assessment Total Assessment is a certain percentage of the fair market value that is determined by local assessors to be the total taxable value of land and additions on the property. | Land | Improvement |
|---|---|---|---|---|
| 2024 | $12,102 | $643,700 | $157,100 | $486,600 |
| 2023 | $10,928 | $543,700 | $50,600 | $493,100 |
| 2021 | $11,692 | $524,300 | $48,500 | $475,800 |
| 2020 | $11,928 | $524,300 | $48,500 | $475,800 |
| 2019 | $12,054 | $524,300 | $48,500 | $475,800 |
| 2018 | $11,599 | $515,500 | $48,500 | $467,000 |
| 2017 | $11,599 | $515,500 | $48,500 | $467,000 |
| 2016 | $3,906 | $515,500 | $48,500 | $467,000 |
| 2015 | $11,094 | $515,500 | $48,500 | $467,000 |
| 2014 | $10,738 | $513,300 | $48,500 | $464,800 |
| 2013 | $10,537 | $503,700 | $51,200 | $452,500 |
Source: Public Records
Map
Nearby Homes