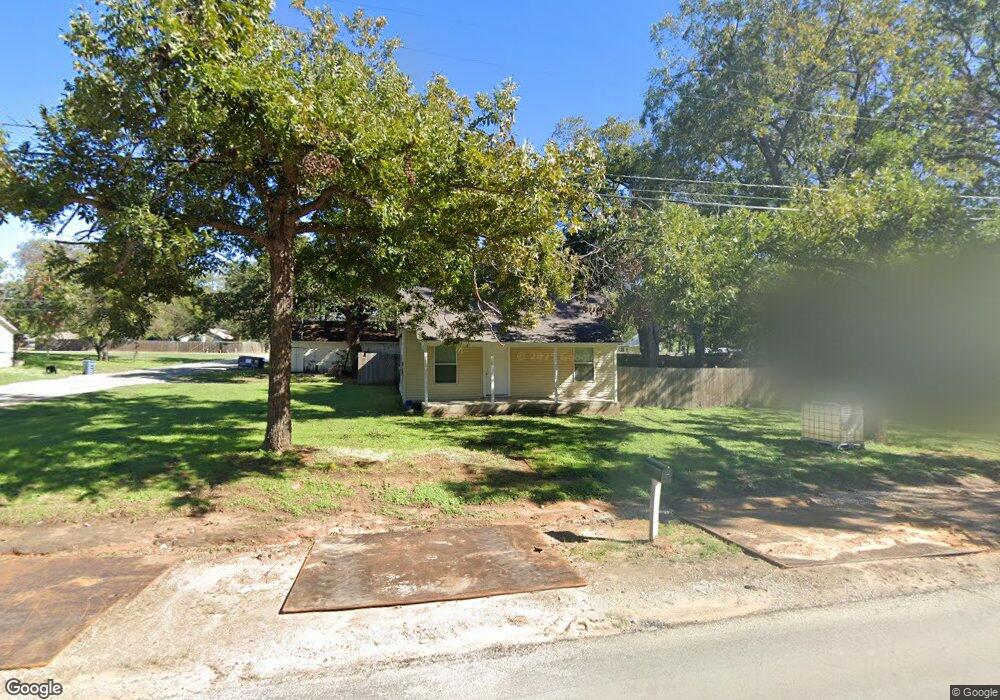
401 S Main St Joshua, TX 76058
Estimated Value: $136,651 - $242,000
2
Beds
1
Bath
878
Sq Ft
$214/Sq Ft
Est. Value
About This Home
This home is located at 401 S Main St, Joshua, TX 76058 and is currently estimated at $188,163, approximately $214 per square foot. 401 S Main St is a home with nearby schools including H.D. Staples Elementary School, R C Loflin Middle School, and Joshua High School.
Ownership History
Date
Name
Owned For
Owner Type
Purchase Details
Closed on
Oct 6, 2016
Sold by
Pope Woodrow Wilson
Bought by
Fancon Llc and Adara Homes
Current Estimated Value
Home Financials for this Owner
Home Financials are based on the most recent Mortgage that was taken out on this home.
Original Mortgage
$42,750
Interest Rate
3.46%
Mortgage Type
Purchase Money Mortgage
Purchase Details
Closed on
Oct 25, 2012
Sold by
Smith David W and Smith Constance A
Bought by
Kahrs James C and Kahrs Sherry
Purchase Details
Closed on
Jul 20, 2005
Sold by
Boatman Lisa
Bought by
Holt Jack
Create a Home Valuation Report for This Property
The Home Valuation Report is an in-depth analysis detailing your home's value as well as a comparison with similar homes in the area
Home Values in the Area
Average Home Value in this Area
Purchase History
| Date | Buyer | Sale Price | Title Company |
|---|---|---|---|
| Fancon Llc | -- | None Available | |
| Kahrs James C | -- | None Available | |
| Holt Jack | -- | None Available |
Source: Public Records
Mortgage History
| Date | Status | Borrower | Loan Amount |
|---|---|---|---|
| Closed | Fancon Llc | $42,750 |
Source: Public Records
Tax History Compared to Growth
Tax History
| Year | Tax Paid | Tax Assessment Tax Assessment Total Assessment is a certain percentage of the fair market value that is determined by local assessors to be the total taxable value of land and additions on the property. | Land | Improvement |
|---|---|---|---|---|
| 2025 | $2,083 | $93,551 | $45,000 | $48,551 |
| 2024 | $2,083 | $85,573 | $0 | $0 |
| 2023 | $1,587 | $71,311 | $45,000 | $26,311 |
| 2022 | $1,441 | $57,448 | $35,000 | $22,448 |
| 2021 | $1,454 | $57,448 | $35,000 | $22,448 |
| 2020 | $1,842 | $67,263 | $35,000 | $32,263 |
| 2019 | $1,687 | $58,627 | $30,000 | $28,627 |
| 2018 | $1,379 | $46,627 | $18,000 | $28,627 |
| 2017 | $1,378 | $46,627 | $18,000 | $28,627 |
| 2016 | $1,378 | $46,627 | $18,000 | $28,627 |
| 2015 | $1,259 | $46,627 | $18,000 | $28,627 |
| 2014 | $1,259 | $46,627 | $18,000 | $28,627 |
Source: Public Records
Map
Nearby Homes