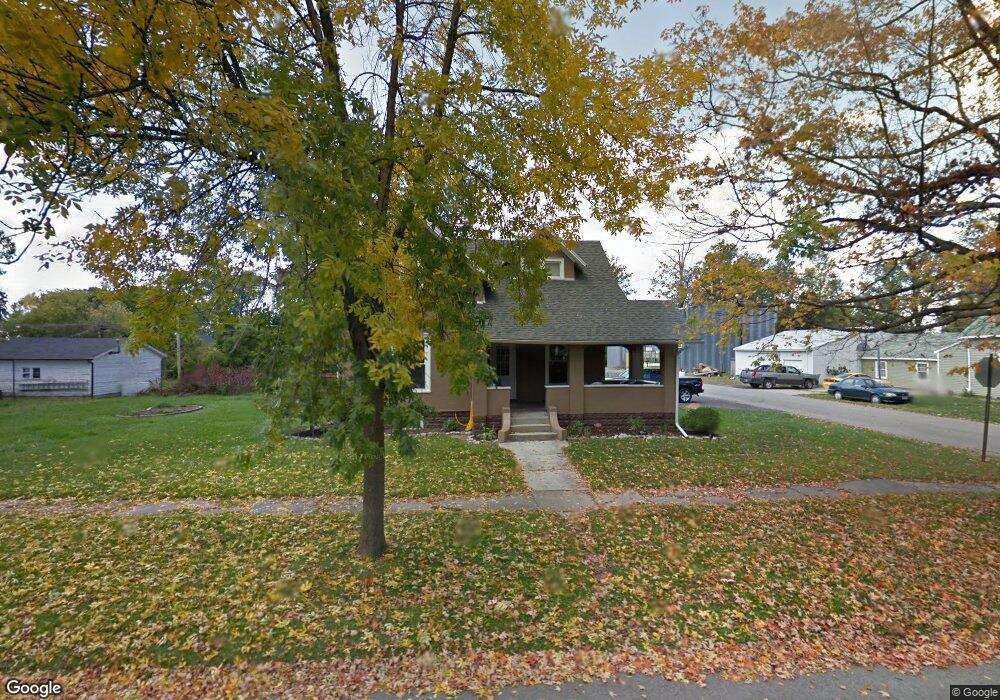
401 S Patterson St Forest, OH 45843
Estimated Value: $121,000 - $158,000
3
Beds
2
Baths
1,536
Sq Ft
$93/Sq Ft
Est. Value
About This Home
This home is located at 401 S Patterson St, Forest, OH 45843 and is currently estimated at $143,601, approximately $93 per square foot. 401 S Patterson St is a home located in Hardin County with nearby schools including Riverdale Middle School and Riverdale High School.
Ownership History
Date
Name
Owned For
Owner Type
Purchase Details
Closed on
Jun 11, 2019
Sold by
Mccall Katelyn M and Vanderpool Katelyn M
Bought by
Mccall Trevor S
Current Estimated Value
Home Financials for this Owner
Home Financials are based on the most recent Mortgage that was taken out on this home.
Original Mortgage
$78,264
Outstanding Balance
$67,947
Interest Rate
4.1%
Mortgage Type
New Conventional
Estimated Equity
$75,654
Purchase Details
Closed on
Jul 29, 2015
Sold by
Haley Timothy P and Haley Jaclyn K
Bought by
Mccall Katelyn M
Home Financials for this Owner
Home Financials are based on the most recent Mortgage that was taken out on this home.
Original Mortgage
$70,408
Interest Rate
4.02%
Mortgage Type
New Conventional
Purchase Details
Closed on
Dec 5, 2002
Bought by
Haley Timothy P and Haley Jaclyn
Purchase Details
Closed on
Oct 20, 2000
Bought by
Haley Timothy P
Purchase Details
Closed on
Jun 20, 1994
Bought by
Hoag Tim W and Hoag Loree L
Create a Home Valuation Report for This Property
The Home Valuation Report is an in-depth analysis detailing your home's value as well as a comparison with similar homes in the area
Purchase History
| Date | Buyer | Sale Price | Title Company |
|---|---|---|---|
| Mccall Trevor S | $76,000 | Whitman Title Security Inc | |
| Mccall Katelyn M | $69,000 | Whitman Title Agency | |
| Haley Timothy P | -- | -- | |
| Haley Timothy P | $61,300 | -- | |
| Hoag Tim W | $40,000 | -- |
Source: Public Records
Mortgage History
| Date | Status | Borrower | Loan Amount |
|---|---|---|---|
| Open | Mccall Trevor S | $78,264 | |
| Previous Owner | Mccall Katelyn M | $70,408 |
Source: Public Records
Tax History
| Year | Tax Paid | Tax Assessment Tax Assessment Total Assessment is a certain percentage of the fair market value that is determined by local assessors to be the total taxable value of land and additions on the property. | Land | Improvement |
|---|---|---|---|---|
| 2024 | $1,322 | $40,570 | $2,100 | $38,470 |
| 2023 | $1,324 | $40,570 | $2,100 | $38,470 |
| 2022 | $1,118 | $29,980 | $1,930 | $28,050 |
| 2021 | $1,212 | $29,980 | $1,930 | $28,050 |
| 2020 | $1,214 | $29,980 | $1,930 | $28,050 |
| 2019 | $930 | $23,930 | $1,840 | $22,090 |
| 2018 | $891 | $23,930 | $1,840 | $22,090 |
| 2017 | $814 | $23,930 | $1,840 | $22,090 |
| 2016 | $739 | $19,420 | $2,150 | $17,270 |
| 2015 | $670 | $19,420 | $2,150 | $17,270 |
| 2014 | $689 | $19,420 | $2,150 | $17,270 |
| 2013 | $675 | $19,420 | $2,150 | $17,270 |
Source: Public Records
Map
Nearby Homes
- 412 S Patterson St
- 0 S Patterson St
- 0 S Davis St
- 511 S Davis St
- 402 E Lima St
- 406 Wells Rd
- 18660 County Road 20
- 0 Cr 215 Unit 11594771
- 0 Cr 215 Unit 11594600
- 0 Cr 215 Unit 25370311
- 0 Cr 215 Unit 11598074
- 3065 County Road 205
- 11270 Township Road 79
- 15047 Ohio 37
- 19507 County Highway 70
- 21426 County Road 17
- 15090 County Road 304
- 5091 County Road 175
- 162 N Main St
- 213 Sandusky St W
- 405 S Patterson St
- 406 S Patterson St
- 311 S Patterson St
- 402 S Davis St
- 406 S Davis St
- 409 S Patterson St
- 312 S Patterson St
- 309 S Patterson St
- 408 S Davis St
- 312 S Davis St
- 411 S Patterson St
- 408 S Patterson St
- 412 S Davis St
- 308 S Patterson St
- 308 S Davis St
- 306 S Patterson St
- 501 S Patterson St
- 310 Mad River St
Your Personal Tour Guide
Ask me questions while you tour the home.