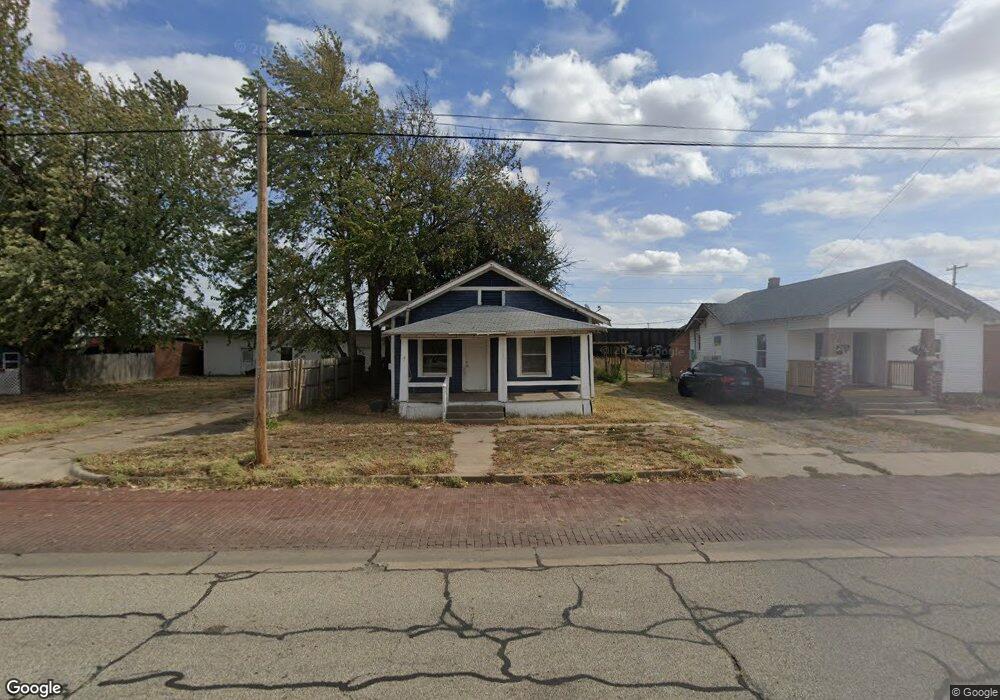
401 S Pine St Ponca City, OK 74601
Estimated Value: $53,000 - $80,351
2
Beds
1
Bath
1,020
Sq Ft
$64/Sq Ft
Est. Value
About This Home
This home is located at 401 S Pine St, Ponca City, OK 74601 and is currently estimated at $64,838, approximately $63 per square foot. 401 S Pine St is a home located in Kay County with nearby schools including Lincoln Elementary School, Ponca City East Middle School, and Ponca City West Middle School.
Ownership History
Date
Name
Owned For
Owner Type
Purchase Details
Closed on
Jun 19, 2023
Sold by
Wilson Adam B
Bought by
Ponca Central Properties Llc
Current Estimated Value
Purchase Details
Closed on
Jun 24, 2020
Sold by
Wilson Adam B
Bought by
Wilson Sarah E
Purchase Details
Closed on
Jul 11, 2003
Sold by
Maggie John L and Maggie Miller
Bought by
Lawrence T Adams
Purchase Details
Closed on
May 17, 2001
Sold by
Maggie John and Maggie Miller
Bought by
John Miller
Create a Home Valuation Report for This Property
The Home Valuation Report is an in-depth analysis detailing your home's value as well as a comparison with similar homes in the area
Home Values in the Area
Average Home Value in this Area
Purchase History
| Date | Buyer | Sale Price | Title Company |
|---|---|---|---|
| Ponca Central Properties Llc | -- | None Listed On Document | |
| Ponca South Properties Llc | -- | None Listed On Document | |
| Wilson Sarah E | -- | None Available | |
| Lawrence T Adams | $17,500 | -- | |
| John Miller | -- | -- |
Source: Public Records
Tax History Compared to Growth
Tax History
| Year | Tax Paid | Tax Assessment Tax Assessment Total Assessment is a certain percentage of the fair market value that is determined by local assessors to be the total taxable value of land and additions on the property. | Land | Improvement |
|---|---|---|---|---|
| 2024 | $233 | $2,459 | $246 | $2,213 |
| 2023 | $233 | $2,342 | $246 | $2,096 |
| 2022 | $212 | $2,230 | $246 | $1,984 |
| 2021 | $213 | $2,230 | $246 | $1,984 |
| 2020 | $210 | $2,220 | $246 | $1,974 |
| 2019 | $202 | $2,115 | $246 | $1,869 |
| 2018 | $206 | $2,130 | $246 | $1,884 |
| 2017 | $209 | $2,130 | $246 | $1,884 |
| 2016 | $179 | $1,805 | $176 | $1,629 |
| 2015 | $178 | $1,790 | $176 | $1,614 |
| 2014 | $178 | $1,821 | $176 | $1,645 |
Source: Public Records
Map
Nearby Homes