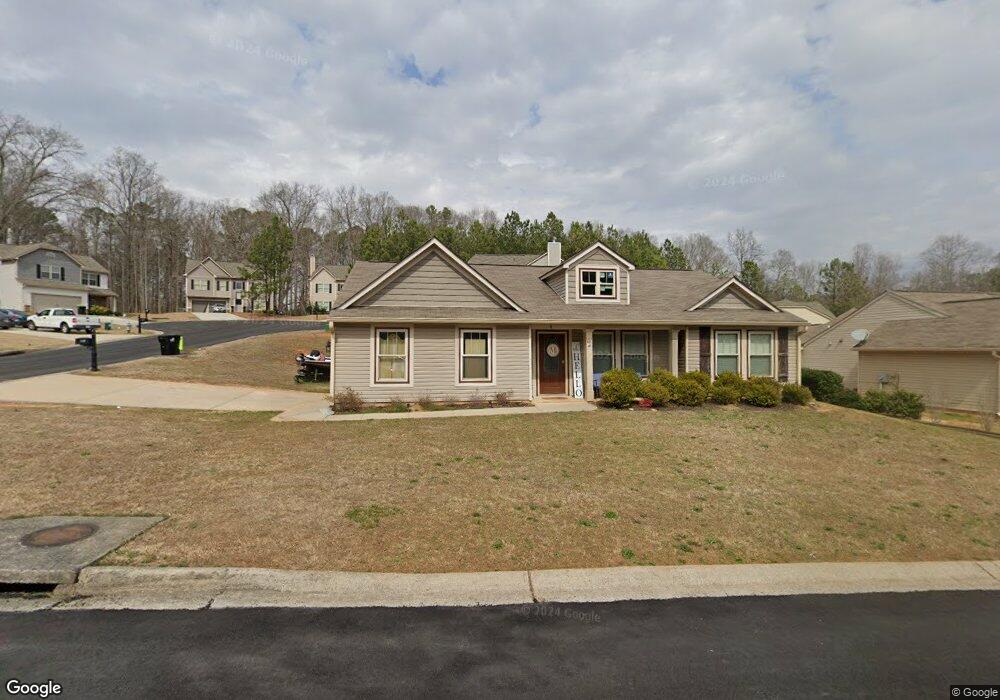
401 Sapling Ct Temple, GA 30179
Estimated Value: $263,844 - $358,000
3
Beds
2
Baths
1,676
Sq Ft
$180/Sq Ft
Est. Value
About This Home
This home is located at 401 Sapling Ct, Temple, GA 30179 and is currently estimated at $301,961, approximately $180 per square foot. 401 Sapling Ct is a home located in Carroll County with nearby schools including Temple Elementary School, Temple Middle School, and Temple High School.
Ownership History
Date
Name
Owned For
Owner Type
Purchase Details
Closed on
Oct 19, 2020
Sold by
Progress Atlanta Llc
Bought by
Progress Residential Borrower 15 Llc
Current Estimated Value
Purchase Details
Closed on
Dec 27, 2019
Sold by
Cochran Quality Homes Llc
Bought by
Progress Atlanta Llc
Purchase Details
Closed on
Nov 5, 2019
Sold by
Midfirst Bank
Bought by
Cochran Quality Homes Llc
Purchase Details
Closed on
Feb 21, 2018
Sold by
Tranquility Financial Svcs
Bought by
Farr Robert
Home Financials for this Owner
Home Financials are based on the most recent Mortgage that was taken out on this home.
Original Mortgage
$162,894
Interest Rate
4.12%
Mortgage Type
FHA
Purchase Details
Closed on
Nov 30, 2016
Sold by
Not Provided
Bought by
Tranquility Place Financial Sv
Purchase Details
Closed on
Oct 23, 2013
Sold by
Federal Deposit Insurance Corporation
Bought by
Nu Wave Homes Llc
Purchase Details
Closed on
Apr 7, 2008
Sold by
Not Provided
Bought by
Douglas County Bank
Create a Home Valuation Report for This Property
The Home Valuation Report is an in-depth analysis detailing your home's value as well as a comparison with similar homes in the area
Home Values in the Area
Average Home Value in this Area
Purchase History
| Date | Buyer | Sale Price | Title Company |
|---|---|---|---|
| Progress Residential Borrower 15 Llc | -- | -- | |
| Progress Atlanta Llc | $170,000 | -- | |
| Cochran Quality Homes Llc | $135,000 | -- | |
| Farr Robert | $165,900 | -- | |
| Tranquility Place Financial Sv | $48,000 | -- | |
| Nu Wave Homes Llc | $95,000 | -- | |
| Douglas County Bank | -- | -- |
Source: Public Records
Mortgage History
| Date | Status | Borrower | Loan Amount |
|---|---|---|---|
| Previous Owner | Farr Robert | $162,894 |
Source: Public Records
Tax History
| Year | Tax Paid | Tax Assessment Tax Assessment Total Assessment is a certain percentage of the fair market value that is determined by local assessors to be the total taxable value of land and additions on the property. | Land | Improvement |
|---|---|---|---|---|
| 2025 | $2,516 | $94,829 | $7,200 | $87,629 |
| 2024 | $2,540 | $94,829 | $7,200 | $87,629 |
| 2023 | $2,540 | $94,830 | $7,200 | $87,630 |
| 2022 | $2,604 | $86,065 | $8,000 | $78,065 |
| 2021 | $2,328 | $74,892 | $8,000 | $66,892 |
| 2020 | $2,087 | $66,850 | $8,000 | $58,850 |
| 2019 | $2,047 | $65,025 | $8,000 | $57,025 |
| 2018 | $1,788 | $55,217 | $8,000 | $47,217 |
| 2017 | $157 | $8,000 | $8,000 | $0 |
| 2016 | $112 | $4,000 | $4,000 | $0 |
| 2015 | $87 | $2,500 | $2,500 | $0 |
| 2014 | $30 | $2,500 | $2,500 | $0 |
Source: Public Records
Map
Nearby Homes
- 400 Sapling Ct
- 215 Lakeview Dr
- 92 James St
- 185 Enterprise Dr
- 511 Azalea Way
- 511 Azalea Way Unit 54
- 95 Carrollton St
- 51 Carrollton St
- 25 Old Bremen Rd
- 28 Ringer St
- 0 Highway 113 Unit 10586141
- 44 E Johnson St
- 358 Daffodil Dr
- 501 Grace Ct
- 96 Rome St
- 249 Carrollton St
- 401 Old Bremen Rd
- 119 E Johnson St
- 317 Brook Ct
- 221 Rome St
- 173 Sourwood Ln Unit 25
- 173 Sourwood Ln
- 425 Sapling Ct
- 312 Yaupon Ct
- 412 Sapling Ct
- 300 Yaupon Ct
- 168 Sourwood Ln
- 178 Sourwood Ln
- 172 Sourwood Ln
- 437 Sapling Ct
- 424 Sapling Ct
- 190 Sourwood Ln
- 166 Sourwood Ln
- 184 Sourwood Ln
- 436 Sapling Ct
- 324 Yaupon Ct
- 160 Sourwood Ln
- 313 Yaupon Ct
- 156 Sourwood Ln
- 301 Yaupon Ct
Your Personal Tour Guide
Ask me questions while you tour the home.