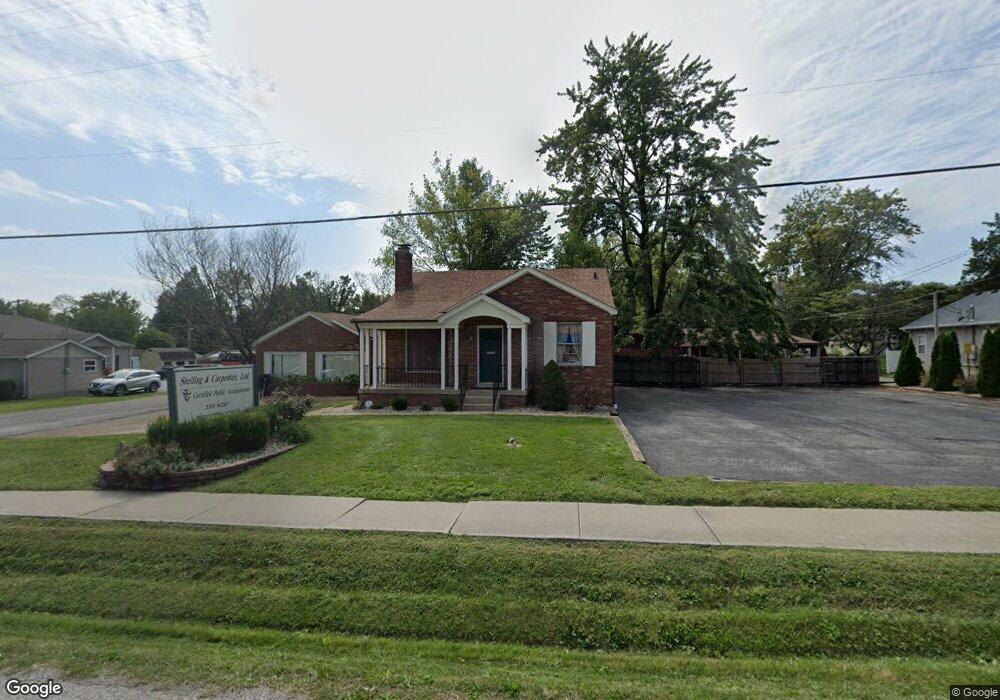
401 Sherman St Belleville, IL 62221
Estimated Value: $134,000 - $200,000
--
Bed
--
Bath
1,634
Sq Ft
$103/Sq Ft
Est. Value
About This Home
This home is located at 401 Sherman St, Belleville, IL 62221 and is currently estimated at $168,471, approximately $103 per square foot. 401 Sherman St is a home located in St. Clair County with nearby schools including Jefferson Elementary School, West Jr High School, and St Teresa Catholic School.
Ownership History
Date
Name
Owned For
Owner Type
Purchase Details
Closed on
May 29, 2025
Sold by
Fannie Mae and Federal National Mortgage Assn
Bought by
Rushing Courtney
Current Estimated Value
Purchase Details
Closed on
Jul 18, 2007
Sold by
Carpenter Stelling Rosie K
Bought by
Stelling James E and Carpenter Stelling Rosie K
Home Financials for this Owner
Home Financials are based on the most recent Mortgage that was taken out on this home.
Original Mortgage
$127,000
Interest Rate
6.54%
Mortgage Type
Stand Alone Refi Refinance Of Original Loan
Purchase Details
Closed on
Feb 20, 2002
Sold by
Battoe Rita A
Bought by
Carpenter Stelling Rosie K
Home Financials for this Owner
Home Financials are based on the most recent Mortgage that was taken out on this home.
Original Mortgage
$120,000
Interest Rate
7.5%
Mortgage Type
Purchase Money Mortgage
Create a Home Valuation Report for This Property
The Home Valuation Report is an in-depth analysis detailing your home's value as well as a comparison with similar homes in the area
Home Values in the Area
Average Home Value in this Area
Purchase History
| Date | Buyer | Sale Price | Title Company |
|---|---|---|---|
| Rushing Courtney | $121,000 | None Available | |
| Stelling James E | -- | First County Title | |
| Carpenter Stelling Rosie K | $110,000 | First American Title Ins |
Source: Public Records
Mortgage History
| Date | Status | Borrower | Loan Amount |
|---|---|---|---|
| Previous Owner | Stelling James E | $127,000 | |
| Previous Owner | Carpenter Stelling Rosie K | $120,000 |
Source: Public Records
Tax History Compared to Growth
Tax History
| Year | Tax Paid | Tax Assessment Tax Assessment Total Assessment is a certain percentage of the fair market value that is determined by local assessors to be the total taxable value of land and additions on the property. | Land | Improvement |
|---|---|---|---|---|
| 2024 | $4,058 | $46,147 | $9,474 | $36,673 |
| 2023 | $4,246 | $45,233 | $9,286 | $35,947 |
| 2022 | $3,897 | $40,721 | $8,360 | $32,361 |
| 2021 | $3,753 | $37,646 | $7,729 | $29,917 |
| 2020 | $3,648 | $35,601 | $7,309 | $28,292 |
| 2019 | $3,269 | $31,553 | $7,687 | $23,866 |
| 2018 | $3,196 | $30,871 | $7,521 | $23,350 |
| 2017 | $3,171 | $30,654 | $7,468 | $23,186 |
| 2016 | $3,131 | $30,003 | $7,309 | $22,694 |
| 2014 | $3,941 | $42,624 | $8,277 | $34,347 |
| 2013 | $3,900 | $43,233 | $8,395 | $34,838 |
Source: Public Records
Map
Nearby Homes
- 1922 E C St
- 2000 E C St
- 1801 E C St
- 325 N Delaware Ave
- 1715 Muren Blvd
- 1801 E Belle Ave
- 1813 Page Ave
- 1606 E Belle Ave
- 1719 Page Ave
- 804 Dewey St
- 1712 Scheel St
- 2122 E Belle Ave
- 1715 Scheel St
- 2134 E Belle Ave
- 1505 Muren Blvd
- 1621 La Salle St
- 1636 N Charles St
- 9 N Delaware Ave
- 2505 E Main St
- 1803 Scheel St