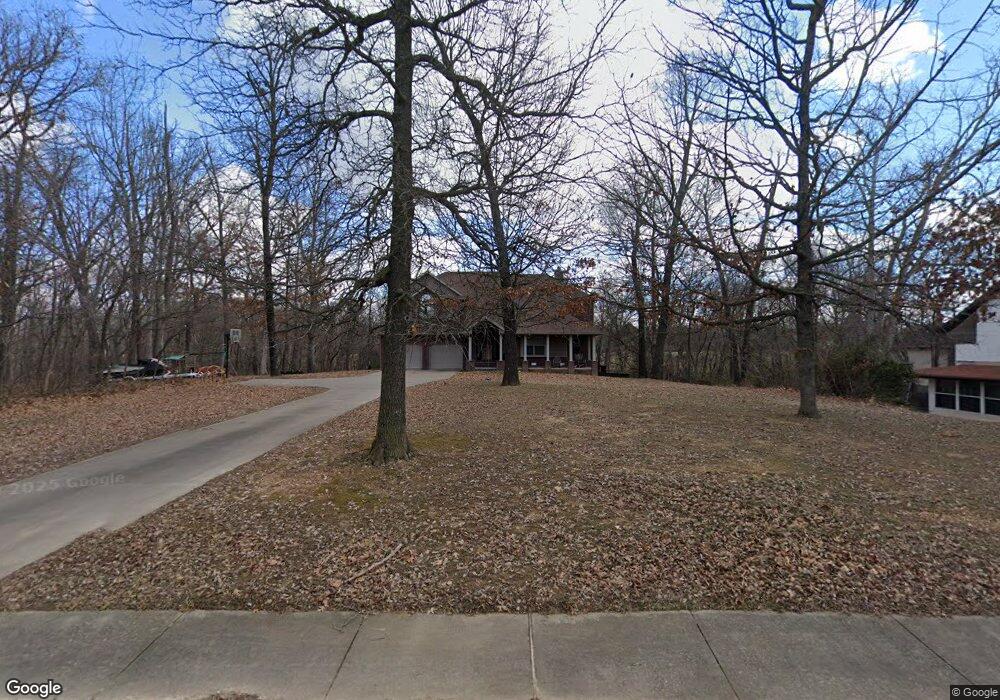
401 SW Tunbridge Dr Bentonville, AR 72712
Estimated Value: $653,000 - $734,000
--
Bed
3
Baths
2,845
Sq Ft
$248/Sq Ft
Est. Value
About This Home
This home is located at 401 SW Tunbridge Dr, Bentonville, AR 72712 and is currently estimated at $704,992, approximately $247 per square foot. 401 SW Tunbridge Dr is a home located in Benton County with nearby schools including R.E. Baker Elementary School, Ardis Ann Middle School, and Lincoln Junior High School.
Ownership History
Date
Name
Owned For
Owner Type
Purchase Details
Closed on
Jun 20, 2003
Bought by
Pendley
Current Estimated Value
Purchase Details
Closed on
Dec 30, 2002
Bought by
Neighborhood
Purchase Details
Closed on
Jul 18, 2001
Bought by
Jd Lindsey 14P
Purchase Details
Closed on
Mar 14, 2000
Bought by
R & L Properties 121P
Purchase Details
Closed on
Feb 24, 2000
Bought by
R & L Properties 121P
Purchase Details
Closed on
Jan 10, 2000
Bought by
R & L Properties 121P
Purchase Details
Closed on
Sep 15, 1999
Bought by
Je Lindsey Ltd Family Partnership 129P
Purchase Details
Closed on
Mar 30, 1999
Bought by
N and A
Purchase Details
Closed on
Jan 13, 1999
Bought by
Crew & Associates Inc
Purchase Details
Closed on
Jan 11, 1999
Bought by
Clarksville Assoc Inc
Purchase Details
Closed on
Sep 21, 1998
Bought by
Crews
Purchase Details
Closed on
Sep 16, 1998
Bought by
Clarksville & Assoc Inc
Create a Home Valuation Report for This Property
The Home Valuation Report is an in-depth analysis detailing your home's value as well as a comparison with similar homes in the area
Home Values in the Area
Average Home Value in this Area
Purchase History
| Date | Buyer | Sale Price | Title Company |
|---|---|---|---|
| Pendley | $36,000 | -- | |
| Neighborhood | $23,000 | -- | |
| Jd Lindsey 14P | $433,000 | -- | |
| R & L Properties 121P | -- | -- | |
| R & L Properties 121P | -- | -- | |
| R & L Properties 121P | -- | -- | |
| Je Lindsey Ltd Family Partnership 129P | -- | -- | |
| Je Lindsey Ltd Family Partnership 129P | $2,368,000 | -- | |
| N | -- | -- | |
| Crew & Associates Inc | -- | -- | |
| Clarksville Assoc Inc | -- | -- | |
| Crews | -- | -- | |
| Clarksville & Assoc Inc | -- | -- |
Source: Public Records
Tax History Compared to Growth
Tax History
| Year | Tax Paid | Tax Assessment Tax Assessment Total Assessment is a certain percentage of the fair market value that is determined by local assessors to be the total taxable value of land and additions on the property. | Land | Improvement |
|---|---|---|---|---|
| 2025 | $4,125 | $112,539 | $24,000 | $88,539 |
| 2024 | $3,955 | $112,539 | $24,000 | $88,539 |
| 2023 | $3,767 | $76,410 | $11,400 | $65,010 |
| 2022 | $3,315 | $76,410 | $11,400 | $65,010 |
| 2021 | $3,136 | $76,410 | $11,400 | $65,010 |
| 2020 | $3,001 | $56,170 | $6,200 | $49,970 |
| 2019 | $2,866 | $56,170 | $6,200 | $49,970 |
| 2018 | $2,756 | $56,170 | $6,200 | $49,970 |
| 2017 | $2,397 | $56,170 | $6,200 | $49,970 |
| 2016 | $2,397 | $56,170 | $6,200 | $49,970 |
| 2015 | $2,620 | $42,400 | $7,300 | $35,100 |
| 2014 | $2,270 | $42,400 | $7,300 | $35,100 |
Source: Public Records
Map
Nearby Homes
- 206 SW Tunbridge Dr
- 2703 SW 8th St
- 2904 SW 2nd St
- 101 Oakhurst St
- 3102 SW Orchard Way
- 0 SW 2nd St
- 3106 SW Orchard Way
- 301 SW Ramsey Ln
- 113 NW Orchard Way
- 905 SW Apache Ct
- 214 El Contento Dr
- 911 SW Cheyenne Dr
- 3104 Mimosa Way
- 3100 NW Alberta
- 3202 Mimosa Way
- 700 SW Sterling Place
- 3631 Bitterroot Cove
- 1100 SW Tunbridge Dr
- 42 Cheryl Cir
- 2903 SW Camden Dr
- 403 Tunbridge Dr
- 405 SW Tunbridge Dr
- 505 SW Maidstone Ave
- 501 SW Tunbridge Dr
- 601 SW Maidstone Ave
- 503 SW Maidstone Ave
- 502 SW Brighton Dr
- 503 SW Tunbridge Dr
- 600 SW Brighton Dr
- 500 SW Brighton Dr
- 701 SW Maidstone Ave
- 506 SW Maidstone Ave
- 200 !Dnp! Res for Sale
- 100 !Dnp! Res for Sale
- 103 !Dnp! Res for Sale
- 100 !Dnp! Res for Sale
- 604 SW Brighton Dr
- 508 SW Maidstone Ave
- 301 SW Tunbridge Dr