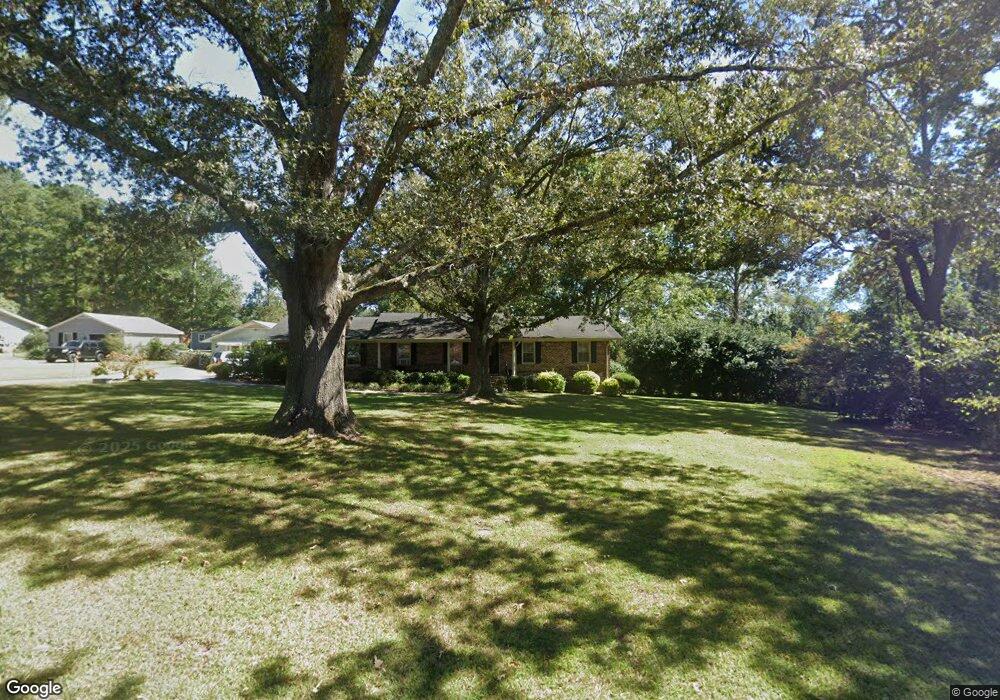
401 Treetop Dr Bremen, GA 30110
Estimated Value: $240,550 - $303,000
3
Beds
2
Baths
1,474
Sq Ft
$183/Sq Ft
Est. Value
About This Home
This home is located at 401 Treetop Dr, Bremen, GA 30110 and is currently estimated at $269,888, approximately $183 per square foot. 401 Treetop Dr is a home located in Haralson County with nearby schools including Jones Elementary School, Bremen 4th & 5th Grade Academy, and Bremen Middle School.
Ownership History
Date
Name
Owned For
Owner Type
Purchase Details
Closed on
Apr 28, 2022
Sold by
Denalsky Edward J
Bought by
Denalsky Edward J and Denalsky Christine J
Current Estimated Value
Home Financials for this Owner
Home Financials are based on the most recent Mortgage that was taken out on this home.
Original Mortgage
$90,000
Outstanding Balance
$85,012
Interest Rate
5.11%
Mortgage Type
New Conventional
Estimated Equity
$184,876
Purchase Details
Closed on
Sep 15, 2006
Sold by
Not Provided
Bought by
Denalsky Edward J and Denalsky Christine J
Home Financials for this Owner
Home Financials are based on the most recent Mortgage that was taken out on this home.
Original Mortgage
$121,120
Interest Rate
1.5%
Mortgage Type
New Conventional
Purchase Details
Closed on
Mar 18, 1996
Sold by
Jones Jones H and Jones Irma
Bought by
Jones Irma S
Purchase Details
Closed on
Feb 10, 1978
Bought by
Jones Jones H and Jones Irma
Create a Home Valuation Report for This Property
The Home Valuation Report is an in-depth analysis detailing your home's value as well as a comparison with similar homes in the area
Home Values in the Area
Average Home Value in this Area
Purchase History
| Date | Buyer | Sale Price | Title Company |
|---|---|---|---|
| Denalsky Edward J | -- | -- | |
| Denalsky Edward J | -- | -- | |
| Denalsky Edward J | $151,400 | -- | |
| Jones Irma S | -- | -- | |
| Jones Jones H | $40,500 | -- |
Source: Public Records
Mortgage History
| Date | Status | Borrower | Loan Amount |
|---|---|---|---|
| Open | Denalsky Edward J | $90,000 | |
| Previous Owner | Denalsky Edward J | $121,120 |
Source: Public Records
Tax History
| Year | Tax Paid | Tax Assessment Tax Assessment Total Assessment is a certain percentage of the fair market value that is determined by local assessors to be the total taxable value of land and additions on the property. | Land | Improvement |
|---|---|---|---|---|
| 2025 | $1,930 | $126,316 | $22,320 | $103,996 |
| 2024 | $1,930 | $69,336 | $6,400 | $62,936 |
| 2023 | $2,424 | $81,277 | $6,400 | $74,877 |
| 2022 | $618 | $66,096 | $6,400 | $59,696 |
| 2021 | $612 | $62,560 | $6,400 | $56,160 |
| 2020 | $664 | $67,419 | $6,400 | $61,019 |
| 2019 | $547 | $54,132 | $6,400 | $47,732 |
| 2018 | $555 | $54,132 | $6,400 | $47,732 |
| 2017 | $620 | $54,323 | $6,400 | $47,923 |
| 2016 | $581 | $48,778 | $6,400 | $42,378 |
| 2015 | $525 | $44,110 | $6,400 | $37,711 |
| 2014 | $568 | $44,560 | $6,400 | $38,160 |
Source: Public Records
Map
Nearby Homes
- 126 Covered Bridge Rd
- 338 Springwater Way
- 354 Springwater Way
- 386 Springwater Way
- 1188 Georgia Ave S
- 1577 Georgia Ave S
- 000 Crosstown Pkwy
- 592 Whittman Ct
- 124 Greystone Dr
- 472 Tucker Trail
- 112 Redding Dr
- 720 Cherokee Rose
- 937 Daylilly Hill
- 812 Brown Thrasher Way
- 501 Mystic Ave
- 112 Summit Ln
- 735 Cherokee Rose
- 83 Twin Creeks Dr
- 809 Laurel St
- 805 Laurel St
- 416 Treetop Dr
- 381 Treetop Dr
- 400 Treetop Dr
- 380 Treetop Dr
- 419 Treetop Dr
- 69 Treetop Dr
- 89 Treetop Dr
- 467 Treetop Dr
- 361 Treetop Dr
- 107 Treetop Dr
- 442 Treetop Dr
- 360 Treetop Dr
- 117 Covered Bridge Rd
- 127 Treetop Dr
- 105 Covered Bridge Rd
- 49 Treetop Dr
- 125 Covered Bridge Rd
- 68 Treetop Dr
- 450 Treetop Dr
- 460 Treetop Dr
Your Personal Tour Guide
Ask me questions while you tour the home.