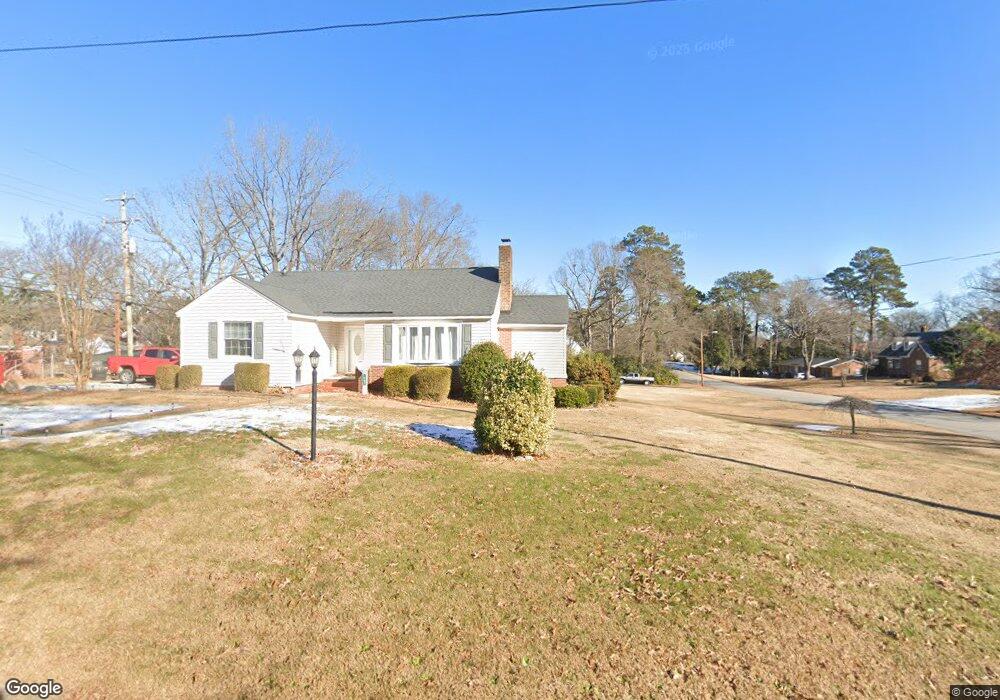
401 W 8th St Roanoke Rapids, NC 27870
Estimated Value: $120,000 - $172,000
3
Beds
1
Bath
1,234
Sq Ft
$119/Sq Ft
Est. Value
About This Home
This home is located at 401 W 8th St, Roanoke Rapids, NC 27870 and is currently estimated at $146,538, approximately $118 per square foot. 401 W 8th St is a home located in Halifax County with nearby schools including Roanoke Rapids High School and Victory Christian Academy.
Ownership History
Date
Name
Owned For
Owner Type
Purchase Details
Closed on
Feb 19, 2024
Sold by
Jones Mary Beth and Jones Peter A
Bought by
Allen Douglas Mark
Current Estimated Value
Home Financials for this Owner
Home Financials are based on the most recent Mortgage that was taken out on this home.
Original Mortgage
$166,504
Outstanding Balance
$163,589
Interest Rate
6.66%
Mortgage Type
VA
Estimated Equity
-$17,051
Purchase Details
Closed on
Jul 14, 2010
Sold by
Jones Mary Beth and Jones Robert P
Bought by
Jones Mary Beth
Create a Home Valuation Report for This Property
The Home Valuation Report is an in-depth analysis detailing your home's value as well as a comparison with similar homes in the area
Home Values in the Area
Average Home Value in this Area
Purchase History
| Date | Buyer | Sale Price | Title Company |
|---|---|---|---|
| Allen Douglas Mark | $165,000 | None Listed On Document | |
| Jones Mary Beth | -- | None Available |
Source: Public Records
Mortgage History
| Date | Status | Borrower | Loan Amount |
|---|---|---|---|
| Open | Allen Douglas Mark | $166,504 |
Source: Public Records
Tax History Compared to Growth
Tax History
| Year | Tax Paid | Tax Assessment Tax Assessment Total Assessment is a certain percentage of the fair market value that is determined by local assessors to be the total taxable value of land and additions on the property. | Land | Improvement |
|---|---|---|---|---|
| 2025 | $18 | $96,400 | $25,800 | $70,600 |
| 2024 | $18 | $96,400 | $25,800 | $70,600 |
| 2023 | $1,709 | $86,000 | $25,800 | $60,200 |
| 2022 | $1,720 | $86,000 | $25,800 | $60,200 |
| 2021 | $1,660 | $86,000 | $25,800 | $60,200 |
| 2020 | $1,661 | $86,000 | $25,800 | $60,200 |
| 2019 | $1,624 | $82,700 | $25,800 | $56,900 |
| 2018 | $1,587 | $82,700 | $25,800 | $56,900 |
| 2017 | $1,582 | $82,700 | $25,800 | $56,900 |
| 2016 | $1,633 | $82,700 | $25,800 | $56,900 |
| 2015 | $1,559 | $82,700 | $25,800 | $56,900 |
| 2014 | $1,355 | $73,200 | $28,210 | $44,990 |
Source: Public Records
Map
Nearby Homes