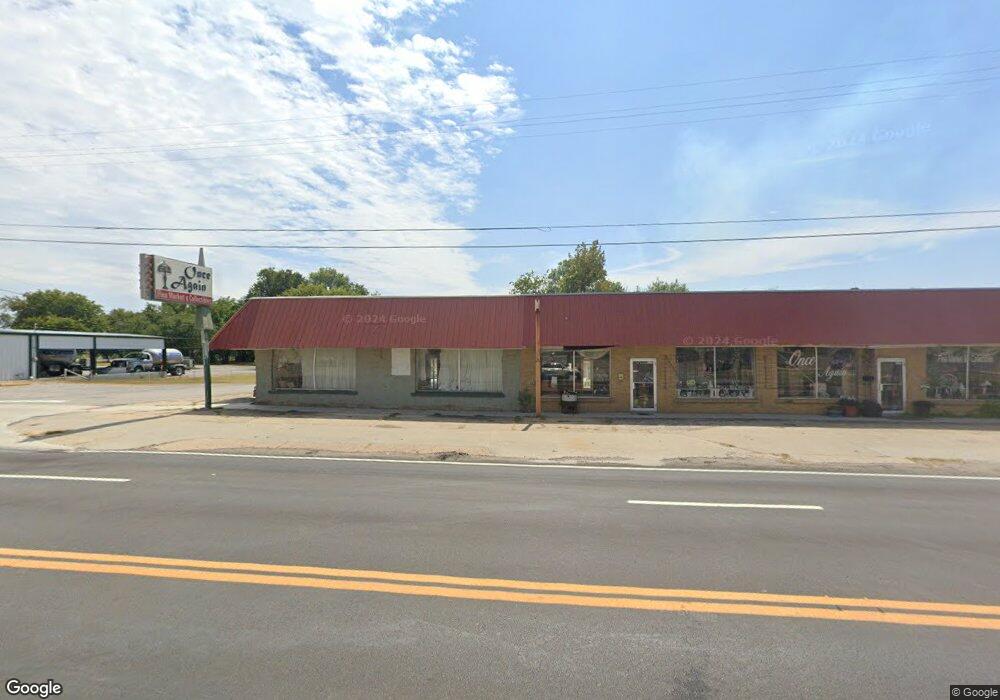
401 W Cherokee St Wagoner, OK 74467
Estimated Value: $151,000
--
Bed
--
Bath
3,226
Sq Ft
$47/Sq Ft
Est. Value
About This Home
This home is located at 401 W Cherokee St, Wagoner, OK 74467 and is currently priced at $151,000, approximately $46 per square foot. 401 W Cherokee St is a home located in Wagoner County with nearby schools including Ellington Elementary School, William R. Teague Elementary School, and Wagoner Middle School.
Ownership History
Date
Name
Owned For
Owner Type
Purchase Details
Closed on
Mar 20, 2013
Sold by
Bays Joyce
Bought by
Bays Joyce and Joyce Bays Revocable Trust
Current Estimated Value
Purchase Details
Closed on
Nov 18, 2008
Sold by
Ohara Carol J
Bought by
Bays Tom and Bays Joyce
Home Financials for this Owner
Home Financials are based on the most recent Mortgage that was taken out on this home.
Original Mortgage
$20,000
Interest Rate
8%
Mortgage Type
Commercial
Purchase Details
Closed on
Jan 20, 2003
Sold by
Parvez Mohammad
Purchase Details
Closed on
Sep 14, 1994
Sold by
First Bank & Trust Co
Purchase Details
Closed on
Aug 24, 1993
Sold by
Engle Dorothy
Create a Home Valuation Report for This Property
The Home Valuation Report is an in-depth analysis detailing your home's value as well as a comparison with similar homes in the area
Home Values in the Area
Average Home Value in this Area
Purchase History
| Date | Buyer | Sale Price | Title Company |
|---|---|---|---|
| Bays Joyce | -- | None Available | |
| Bays Tom | $40,000 | Wagoner County Abstract Comp | |
| -- | $45,000 | -- | |
| -- | $54,000 | -- | |
| -- | -- | -- |
Source: Public Records
Mortgage History
| Date | Status | Borrower | Loan Amount |
|---|---|---|---|
| Previous Owner | Bays Tom | $20,000 |
Source: Public Records
Tax History Compared to Growth
Tax History
| Year | Tax Paid | Tax Assessment Tax Assessment Total Assessment is a certain percentage of the fair market value that is determined by local assessors to be the total taxable value of land and additions on the property. | Land | Improvement |
|---|---|---|---|---|
| 2024 | $589 | $6,383 | $1,681 | $4,702 |
| 2023 | $561 | $6,079 | $1,677 | $4,402 |
| 2022 | $533 | $5,789 | $1,672 | $4,117 |
| 2021 | $511 | $5,514 | $1,665 | $3,849 |
| 2020 | $498 | $5,251 | $1,654 | $3,597 |
| 2019 | $408 | $5,001 | $1,644 | $3,357 |
| 2018 | $412 | $4,763 | $1,406 | $3,357 |
| 2017 | $386 | $4,536 | $1,179 | $3,357 |
| 2016 | $364 | $4,401 | $1,179 | $3,222 |
| 2015 | -- | $4,401 | $1,179 | $3,222 |
| 2014 | -- | $4,401 | $1,179 | $3,222 |
Source: Public Records
Map
Nearby Homes
- 25820 Oklahoma 51
- 101 NE 2nd St
- 407 N Rice Ave
- 0 SW 2nd St
- 0 S Taylor Ave
- 304 NW 5th St
- 800 SW 4th St
- 307 S Lee Ave
- 306 S State St
- 0 S Polk Ave
- 1406 S Polk Ave
- 408 NW 7th St
- 412 NW 7th St
- 402 N Lincoln Ave
- 1406 S Filmore Ave
- 808 SW 8th St
- 611 N State St
- 0 SW 9th St Unit 2537168
- 805 N Parkinson Ave
- 701 N State St
- 403 W Cherokee St
- W Oklahoma 51
- 303 W Cherokee St
- 405 W Cherokee St
- 407 W Cherokee St
- 409 W Cherokee St
- 404 W Cherokee St
- 404 W Cherokee St
- 413 W Cherokee St
- 415 W Cherokee St
- 107 N Wagoner Ave
- 304 W Cherokee St
- 416 W Cherokee St
- 217 Rr 2
- 378 Rr 2
- 435 Rr 2
- 402 SW 2nd St
- 402 SW 2nd St
- 417 W Cherokee St
- 417 W Cherokee St