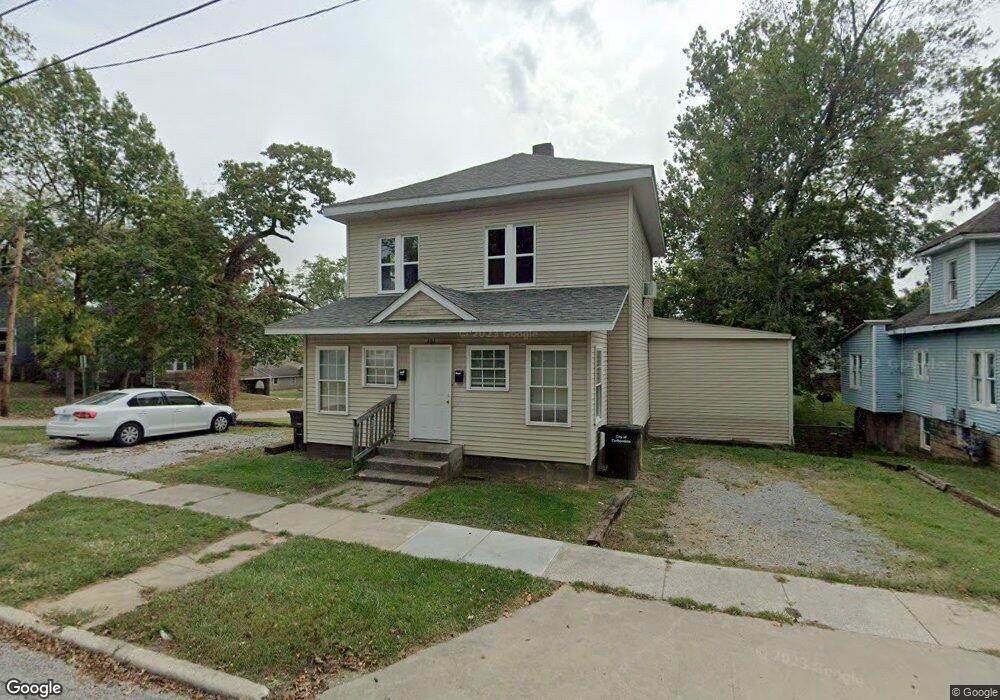
401 W Elm St Unit Duplex with a 2 bed Carbondale, IL 62901
Estimated Value: $90,000 - $208,000
2
Beds
4
Baths
1,317
Sq Ft
$99/Sq Ft
Est. Value
About This Home
This home is located at 401 W Elm St Unit Duplex with a 2 bed, Carbondale, IL 62901 and is currently estimated at $130,959, approximately $99 per square foot. 401 W Elm St Unit Duplex with a 2 bed is a home located in Jackson County with nearby schools including Parrish Elementary School, Thomas Elementary School, and Lewis School.
Ownership History
Date
Name
Owned For
Owner Type
Purchase Details
Closed on
Mar 19, 2024
Sold by
Mackert Jared
Bought by
Trekcam Rentals Llc
Current Estimated Value
Purchase Details
Closed on
Jul 14, 2023
Sold by
Big Muddy Rentals Llc
Bought by
Mackert Jared
Home Financials for this Owner
Home Financials are based on the most recent Mortgage that was taken out on this home.
Original Mortgage
$98,320
Interest Rate
6.79%
Mortgage Type
New Conventional
Purchase Details
Closed on
Jul 12, 2019
Sold by
Martin Gary E
Bought by
Big Muddy Rentals Llc
Home Financials for this Owner
Home Financials are based on the most recent Mortgage that was taken out on this home.
Original Mortgage
$90,000
Interest Rate
3.82%
Mortgage Type
New Conventional
Create a Home Valuation Report for This Property
The Home Valuation Report is an in-depth analysis detailing your home's value as well as a comparison with similar homes in the area
Home Values in the Area
Average Home Value in this Area
Purchase History
| Date | Buyer | Sale Price | Title Company |
|---|---|---|---|
| Trekcam Rentals Llc | -- | None Listed On Document | |
| Mackert Jared | -- | None Listed On Document | |
| Big Muddy Rentals Llc | $92,000 | -- |
Source: Public Records
Mortgage History
| Date | Status | Borrower | Loan Amount |
|---|---|---|---|
| Previous Owner | Mackert Jared | $98,320 | |
| Previous Owner | Big Muddy Rentals Llc | $90,000 |
Source: Public Records
Tax History Compared to Growth
Tax History
| Year | Tax Paid | Tax Assessment Tax Assessment Total Assessment is a certain percentage of the fair market value that is determined by local assessors to be the total taxable value of land and additions on the property. | Land | Improvement |
|---|---|---|---|---|
| 2024 | $4,740 | $41,593 | $3,267 | $38,326 |
| 2023 | $2,255 | $19,076 | $2,959 | $16,117 |
| 2022 | $2,179 | $17,611 | $2,732 | $14,879 |
| 2021 | $2,148 | $16,755 | $2,599 | $14,156 |
| 2020 | $2,081 | $17,052 | $2,645 | $14,407 |
| 2019 | $1,997 | $17,122 | $2,656 | $14,466 |
| 2018 | $3,886 | $35,810 | $2,772 | $33,038 |
| 2017 | $3,912 | $36,484 | $2,772 | $33,712 |
| 2016 | $3,819 | $36,484 | $2,772 | $33,712 |
| 2015 | -- | $26,213 | $2,772 | $23,441 |
| 2014 | -- | $26,213 | $2,772 | $23,441 |
| 2012 | -- | $26,748 | $2,829 | $23,919 |
Source: Public Records
Map
Nearby Homes
- 403 W Elm St
- 405 W Elm St
- 404 W Elm St
- 407 S Beveridge St
- 410 S Ash St
- 403 W Cherry St
- 323 W Walnut St
- 306 W Cherry St
- 406 S University Ave
- 505 W Cherry St Unit 2
- 505 W Cherry St
- 408 S University Ave
- 501 S Poplar St
- 505 S Poplar St
- 334 W Walnut St
- 510 S Beveridge St Unit 16
- 417 W Monroe St
- 900 W Cherry St
- 508 W College St
- 310 W Monroe St Unit 4
- 401 W Elm St
- 401 W Elm St Unit 2- 3 Bed Duplex with
- 401 W Elm St Unit Duplex & 2 bed house
- 402 W Elm St
- 406 S Ash St
- 314 W Elm St
- 311 W Elm St
- 404 Cherry Ct
- 404 Cherry Ct Unit 405,406,407,408,409,
- 404 Cherry Ct
- 405 Cherry Ct
- 406 Cherry Ct
- 406 W Elm St
- 406 Cherry Ct
- 307 W Elm St
- 305 S Beveridge St
- 407 1/2 S Ash St
- 408 W Cherry St
- 312 W Cherry St
- 408 Cherry Ct