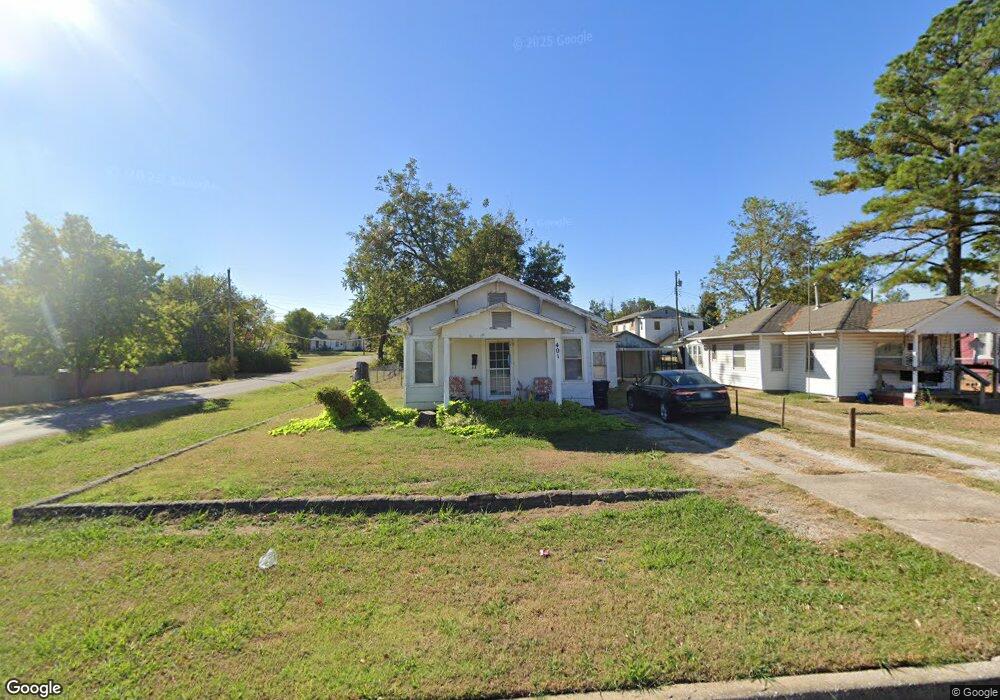
401 W Pulaski St Shawnee, OK 74804
Estimated Value: $73,000 - $112,000
3
Beds
1
Bath
1,020
Sq Ft
$86/Sq Ft
Est. Value
About This Home
This home is located at 401 W Pulaski St, Shawnee, OK 74804 and is currently estimated at $87,308, approximately $85 per square foot. 401 W Pulaski St is a home located in Pottawatomie County with nearby schools including Will Rogers Elementary School, Shawnee Middle School, and Shawnee High School.
Ownership History
Date
Name
Owned For
Owner Type
Purchase Details
Closed on
Jan 11, 2022
Sold by
Luke Dockrey Whitney and Luke June Angela
Bought by
Luke Dockrey Rentals Llc
Current Estimated Value
Purchase Details
Closed on
Mar 19, 2019
Sold by
Westbrook Dawn R and Westbrook Paul C
Bought by
Docltrey Family 2014 Revocable Trust
Purchase Details
Closed on
Jun 10, 2010
Sold by
Clark Rita and Clark Ron
Bought by
Westbrook Paul C and Westbrook Dawn R
Home Financials for this Owner
Home Financials are based on the most recent Mortgage that was taken out on this home.
Original Mortgage
$46,400
Interest Rate
4.93%
Mortgage Type
Unknown
Purchase Details
Closed on
Aug 15, 2007
Sold by
Hobbs Belinda G
Bought by
Clark Rita
Home Financials for this Owner
Home Financials are based on the most recent Mortgage that was taken out on this home.
Original Mortgage
$44,000
Interest Rate
7%
Mortgage Type
Seller Take Back
Create a Home Valuation Report for This Property
The Home Valuation Report is an in-depth analysis detailing your home's value as well as a comparison with similar homes in the area
Home Values in the Area
Average Home Value in this Area
Purchase History
| Date | Buyer | Sale Price | Title Company |
|---|---|---|---|
| Luke Dockrey Rentals Llc | -- | None Listed On Document | |
| Docltrey Family 2014 Revocable Trust | $40,000 | None Available | |
| Westbrook Paul C | $60,000 | None Available | |
| Clark Rita | $54,000 | Fat |
Source: Public Records
Mortgage History
| Date | Status | Borrower | Loan Amount |
|---|---|---|---|
| Previous Owner | Westbrook Paul C | $46,400 | |
| Previous Owner | Clark Rita | $44,000 |
Source: Public Records
Tax History Compared to Growth
Tax History
| Year | Tax Paid | Tax Assessment Tax Assessment Total Assessment is a certain percentage of the fair market value that is determined by local assessors to be the total taxable value of land and additions on the property. | Land | Improvement |
|---|---|---|---|---|
| 2024 | $499 | $5,016 | $1,080 | $3,936 |
| 2023 | $499 | $4,778 | $1,080 | $3,698 |
| 2022 | $490 | $4,778 | $1,080 | $3,698 |
| 2021 | $481 | $4,778 | $1,080 | $3,698 |
| 2020 | $485 | $4,800 | $1,080 | $3,720 |
| 2019 | $477 | $4,566 | $1,080 | $3,486 |
| 2018 | $473 | $4,625 | $1,080 | $3,545 |
| 2017 | $470 | $4,660 | $1,080 | $3,580 |
| 2016 | $481 | $4,717 | $1,080 | $3,637 |
| 2015 | $504 | $5,034 | $1,080 | $3,954 |
| 2014 | $506 | $5,059 | $1,080 | $3,979 |
Source: Public Records
Map
Nearby Homes
- 202 W Franklin St
- 10 W Midland St
- 1925 N Park Ave
- 2021 N Broadway Ave
- 1901 N Bell Ave
- 1817 N Bell Ave
- 2415 N Minnesota Cir
- 1710 N Park Ave
- 401 E Federal St
- 1816 N Bell Ave
- 3306 N Oklahoma Ave
- 1822 N Phil Ave
- 1607 N Beard Ave
- 806 E Midland St
- 1602 N Bdwy
- 1510 N Union Ave
- 2001 N Mckinley Ave
- 29 Timber Creek Way
- 1324 N Park Ave
- 1712 N Pennsylvania Ave
- 405 W Pulaski St
- 411 W Pulaski St
- 2421 N Park Ave
- 417 W Pulaski St
- 227 W Pulaski St
- 304 W Georgia St
- 308 W Georgia St
- 312 W Georgia St
- 232 W Georgia St
- 225 W Pulaski St
- 2501 N Park Ave
- 314 W Georgia St
- 426 W Pulaski St
- 228 W Georgia St
- 427 W Pulaski St
- 320 W Georgia St
- 2505 N Park Ave
- 224 W Georgia St
- 224 W Pulaski St
- 324 W Georgia St