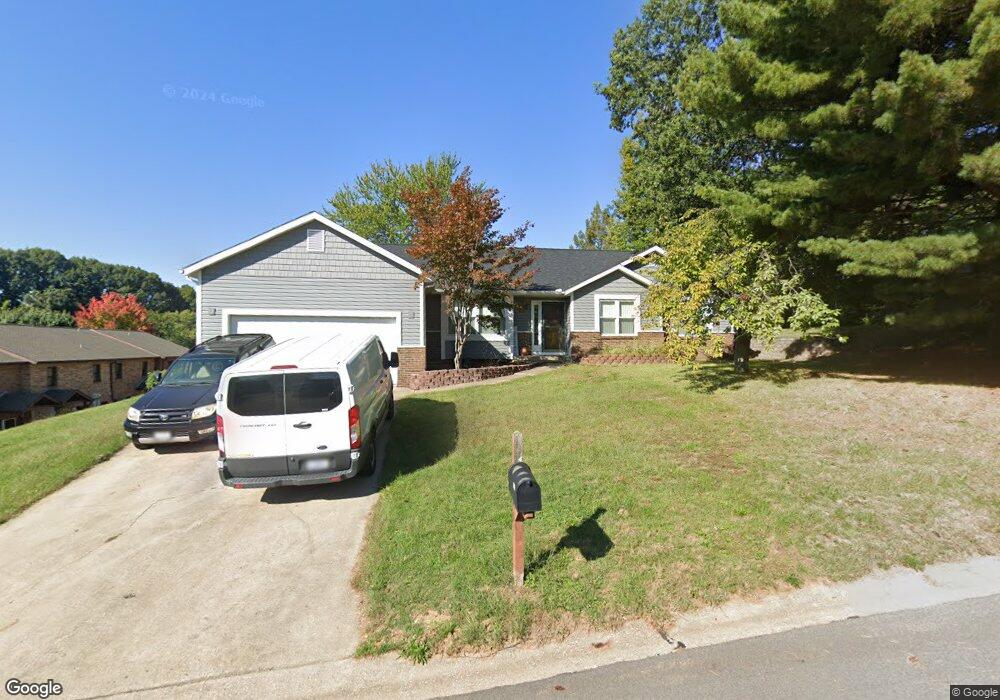
401 Windridge Dr Collinsville, IL 62234
Estimated Value: $251,000 - $309,000
3
Beds
2
Baths
1,881
Sq Ft
$152/Sq Ft
Est. Value
About This Home
This home is located at 401 Windridge Dr, Collinsville, IL 62234 and is currently estimated at $285,078, approximately $151 per square foot. 401 Windridge Dr is a home located in Madison County with nearby schools including John A Renfro Elementary School, Dorris Intermediate School, and Collinsville Middle School.
Ownership History
Date
Name
Owned For
Owner Type
Purchase Details
Closed on
Mar 16, 2012
Sold by
Fedral National Mortgage Assn
Bought by
Palnter Michael
Current Estimated Value
Home Financials for this Owner
Home Financials are based on the most recent Mortgage that was taken out on this home.
Original Mortgage
$126,704
Outstanding Balance
$86,537
Interest Rate
3.75%
Mortgage Type
FHA
Estimated Equity
$198,541
Purchase Details
Closed on
Sep 30, 2011
Sold by
Marcotte Martha Sue and Steigelman Martha S
Bought by
Federal National Mortgage Association
Purchase Details
Closed on
Feb 16, 2007
Sold by
Steigelman Alan C and Steigelman Martha S
Bought by
Steigelman Martha S and Marcotte Martha Sue
Home Financials for this Owner
Home Financials are based on the most recent Mortgage that was taken out on this home.
Original Mortgage
$176,500
Interest Rate
6.27%
Mortgage Type
New Conventional
Create a Home Valuation Report for This Property
The Home Valuation Report is an in-depth analysis detailing your home's value as well as a comparison with similar homes in the area
Home Values in the Area
Average Home Value in this Area
Purchase History
| Date | Buyer | Sale Price | Title Company |
|---|---|---|---|
| Palnter Michael | $130,000 | None Available | |
| Federal National Mortgage Association | -- | None Available | |
| Steigelman Martha S | -- | Title & Escrow Plus Inc |
Source: Public Records
Mortgage History
| Date | Status | Borrower | Loan Amount |
|---|---|---|---|
| Open | Palnter Michael | $126,704 | |
| Previous Owner | Steigelman Martha S | $176,500 |
Source: Public Records
Tax History Compared to Growth
Tax History
| Year | Tax Paid | Tax Assessment Tax Assessment Total Assessment is a certain percentage of the fair market value that is determined by local assessors to be the total taxable value of land and additions on the property. | Land | Improvement |
|---|---|---|---|---|
| 2024 | $4,627 | $78,370 | $14,540 | $63,830 |
| 2023 | $4,627 | $72,540 | $13,460 | $59,080 |
| 2022 | $4,379 | $67,080 | $12,450 | $54,630 |
| 2021 | $3,854 | $61,800 | $11,460 | $50,340 |
| 2020 | $3,697 | $58,960 | $10,930 | $48,030 |
| 2019 | $3,585 | $56,950 | $10,560 | $46,390 |
| 2018 | $3,491 | $53,940 | $10,000 | $43,940 |
| 2017 | $3,800 | $57,090 | $10,470 | $46,620 |
| 2016 | $3,993 | $57,090 | $10,470 | $46,620 |
| 2015 | $2,794 | $55,610 | $10,200 | $45,410 |
| 2014 | $2,794 | $55,610 | $10,200 | $45,410 |
| 2013 | $2,794 | $55,610 | $10,200 | $45,410 |
Source: Public Records
Map
Nearby Homes
- 625 W Country Ln
- 2 Chelsea Rd
- 102 Toni Ct
- 10 White Lily Dr
- 54 Oak Leaf Dr
- 112 Crestmoor St
- 0 N Keebler Ave
- 22 Oak Valley Dr
- 300 Pine Lake Rd Unit 6
- 300 Pine Lake Rd Unit 7
- 203 Greenfield Dr
- 131 E Country Ln
- 6020 Keebler Oaks Dr
- 706 Illinois Ave
- 1227 Ridge Ave
- 104 Summit Ridge Unit 104
- 2033 Mapleleaf Dr
- 1002 California Ave
- 414 Bunker Hill Dr
- 2527 Gecko Dr
- 403 Windridge Dr
- 307 Northcrest Dr
- 305 Northcrest Dr
- 303 Northcrest Dr Unit MM
- 301 Northcrest Dr
- 304 Northcrest Dr
- 400 Windridge Dr
- 309 Northcrest Dr Unit PP
- 302 Northcrest Dr Unit HH
- 306 Northcrest Dr
- 300 Northcrest Dr
- 392 Windridge Dr
- 402 Windridge Dr
- 312 Northcrest Dr
- 314 Northcrest Dr
- 310 Northcrest Dr Unit UU
- 390 Windridge Dr
- 390 Windridge Dr
- 405 Windridge Dr
- 317 Northcrest Dr Unit TT