Estimated Value: $136,323 - $345,000
3
Beds
2
Baths
1,808
Sq Ft
$110/Sq Ft
Est. Value
About This Home
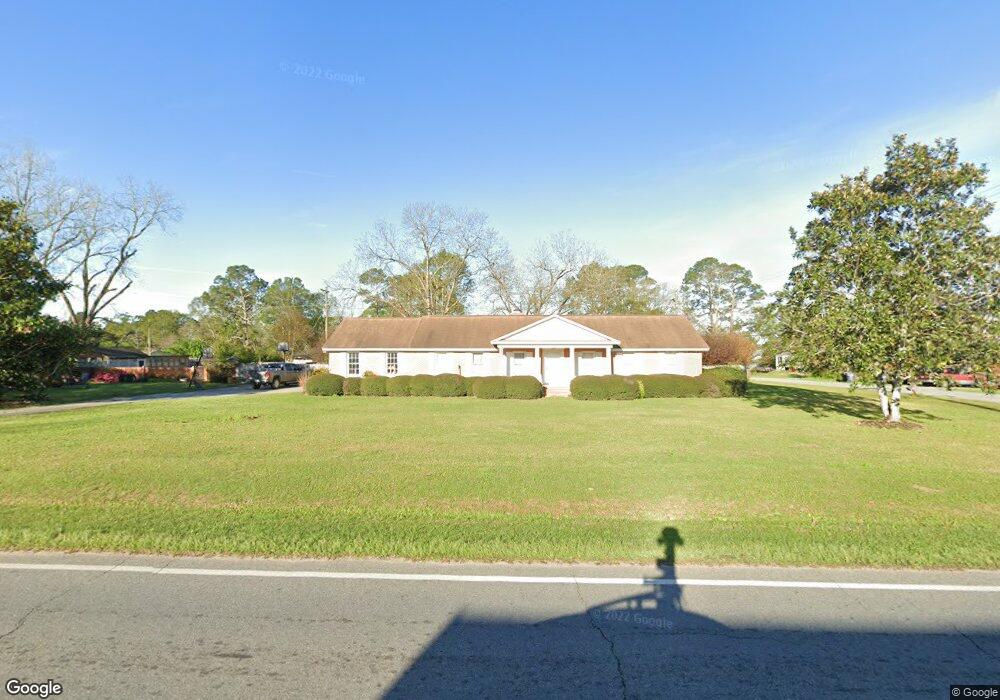
This home is located at 4010 Bedgood Ave, Arabi, GA 31712 and is currently estimated at $198,831, approximately $109 per square foot. 4010 Bedgood Ave is a home located in Crisp County with nearby schools including Crisp County Primary School, Crisp County Elementary School, and Crisp County Middle School.
Ownership History
Date
Name
Owned For
Owner Type
Purchase Details
Closed on
Sep 28, 2018
Sold by
Rodriguez Walls Chelsea
Bought by
Walls Benjamin Hal
Current Estimated Value
Purchase Details
Closed on
Mar 27, 2014
Sold by
Regions Bank Trustee
Bought by
Walls Chelsea Rodriguez
Home Financials for this Owner
Home Financials are based on the most recent Mortgage that was taken out on this home.
Original Mortgage
$79,532
Interest Rate
4.12%
Mortgage Type
FHA
Purchase Details
Closed on
Mar 12, 2014
Sold by
Smith Reggie C
Bought by
Regions Bank Trustee
Home Financials for this Owner
Home Financials are based on the most recent Mortgage that was taken out on this home.
Original Mortgage
$79,532
Interest Rate
4.12%
Mortgage Type
FHA
Purchase Details
Closed on
Feb 14, 2011
Sold by
Smith Reggie C
Bought by
Regions Bank
Purchase Details
Closed on
Jul 20, 1981
Bought by
Smith Reggie C
Create a Home Valuation Report for This Property
The Home Valuation Report is an in-depth analysis detailing your home's value as well as a comparison with similar homes in the area
Purchase History
| Date | Buyer | Sale Price | Title Company |
|---|---|---|---|
| Walls Benjamin Hal | -- | -- | |
| Walls Chelsea Rodriguez | $81,000 | -- | |
| Regions Bank Trustee | -- | -- | |
| Regions Bank | -- | -- | |
| Smith Reggie C | -- | -- |
Source: Public Records
Mortgage History
| Date | Status | Borrower | Loan Amount |
|---|---|---|---|
| Previous Owner | Walls Chelsea Rodriguez | $79,532 |
Source: Public Records
Tax History Compared to Growth
Tax History
| Year | Tax Paid | Tax Assessment Tax Assessment Total Assessment is a certain percentage of the fair market value that is determined by local assessors to be the total taxable value of land and additions on the property. | Land | Improvement |
|---|---|---|---|---|
| 2025 | $1,090 | $45,011 | $2,000 | $43,011 |
| 2024 | $1,052 | $42,466 | $2,000 | $40,466 |
| 2023 | $1,103 | $41,738 | $2,000 | $39,738 |
| 2022 | $1,129 | $42,722 | $2,000 | $40,722 |
| 2021 | $1,198 | $40,401 | $2,000 | $38,401 |
| 2020 | $1,137 | $40,401 | $2,000 | $38,401 |
| 2019 | $1,146 | $40,401 | $2,000 | $38,401 |
| 2018 | $1,050 | $35,626 | $2,340 | $33,286 |
| 2017 | $1,011 | $35,626 | $2,340 | $33,286 |
| 2016 | $1,053 | $35,626 | $2,340 | $33,286 |
| 2015 | -- | $35,626 | $2,340 | $33,286 |
| 2014 | -- | $35,626 | $2,340 | $33,286 |
| 2013 | -- | $35,625 | $2,340 | $33,285 |
Source: Public Records
Map
Nearby Homes
- 104 4th St
- 221 1st St W
- 501 Southern Lakes Dr
- 2453 Georgia 90
- TBD Arabi Warwick Rd
- 2608 U S 41
- 114 Brier Patch Rd
- 2413 Old Hatley Rd
- 2905 Old Hatley Rd
- 3113 Old Hatley Rd
- 0 Aberdeen Circle Lt# 28
- 846 Hawpond Rd
- 104 Aberdeen Cir
- 68 Aberdeen Cir
- 718 Jamestown Rd
- 11 Lochridge Way
- TBD Aberdeen Circle Lot#28
- 854 Rockhouse Rd E
- 49 Aberdeen Cir
- 56 Aberdeen Cir