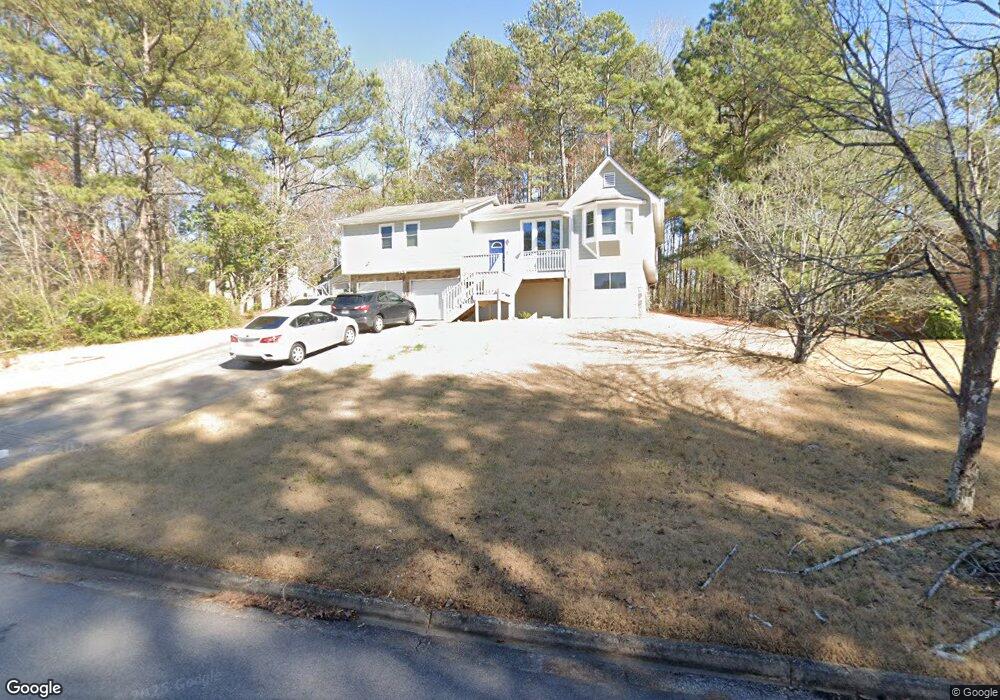
4010 Cranwood Dr Atlanta, GA 30349
Estimated Value: $248,616 - $290,000
3
Beds
3
Baths
1,547
Sq Ft
$174/Sq Ft
Est. Value
About This Home
This home is located at 4010 Cranwood Dr, Atlanta, GA 30349 and is currently estimated at $269,154, approximately $173 per square foot. 4010 Cranwood Dr is a home located in Fulton County with nearby schools including Cliftondale Elementary School, Renaissance Middle School, and Langston Hughes High School.
Ownership History
Date
Name
Owned For
Owner Type
Purchase Details
Closed on
Jul 22, 2011
Sold by
Us Bank Assn 2005 & He7
Bought by
Saboor Janet C
Current Estimated Value
Home Financials for this Owner
Home Financials are based on the most recent Mortgage that was taken out on this home.
Original Mortgage
$38,315
Outstanding Balance
$26,384
Interest Rate
4.53%
Mortgage Type
New Conventional
Estimated Equity
$242,770
Purchase Details
Closed on
Nov 2, 2010
Sold by
Rice Mark E
Bought by
Bear Stearns I Llc 2005 & He7
Purchase Details
Closed on
Feb 4, 2005
Sold by
Rice Mark
Bought by
Rice Mark E
Home Financials for this Owner
Home Financials are based on the most recent Mortgage that was taken out on this home.
Original Mortgage
$105,000
Interest Rate
10.8%
Mortgage Type
New Conventional
Purchase Details
Closed on
May 26, 1999
Sold by
Dixon Racine W and Dixon Stephanie N
Bought by
Rice Mark
Home Financials for this Owner
Home Financials are based on the most recent Mortgage that was taken out on this home.
Original Mortgage
$89,900
Interest Rate
6.9%
Mortgage Type
FHA
Create a Home Valuation Report for This Property
The Home Valuation Report is an in-depth analysis detailing your home's value as well as a comparison with similar homes in the area
Home Values in the Area
Average Home Value in this Area
Purchase History
| Date | Buyer | Sale Price | Title Company |
|---|---|---|---|
| Saboor Janet C | $39,500 | -- | |
| Bear Stearns I Llc 2005 & He7 | $37,651 | -- | |
| Rice Mark E | -- | -- | |
| Rice Mark | $90,000 | -- |
Source: Public Records
Mortgage History
| Date | Status | Borrower | Loan Amount |
|---|---|---|---|
| Open | Saboor Janet C | $38,315 | |
| Closed | Saboor Janet C | $38,315 | |
| Previous Owner | Rice Mark E | $105,000 | |
| Previous Owner | Rice Mark | $89,900 |
Source: Public Records
Tax History Compared to Growth
Tax History
| Year | Tax Paid | Tax Assessment Tax Assessment Total Assessment is a certain percentage of the fair market value that is determined by local assessors to be the total taxable value of land and additions on the property. | Land | Improvement |
|---|---|---|---|---|
| 2025 | $3,949 | $90,360 | $23,120 | $67,240 |
| 2023 | $2,195 | $77,760 | $16,320 | $61,440 |
| 2022 | $1,982 | $50,560 | $8,520 | $42,040 |
| 2021 | $1,664 | $41,560 | $760 | $40,800 |
| 2020 | $1,672 | $41,080 | $760 | $40,320 |
| 2019 | $2,213 | $56,040 | $8,120 | $47,920 |
| 2018 | $2,180 | $54,760 | $7,960 | $46,800 |
| 2017 | $890 | $21,840 | $4,320 | $17,520 |
| 2016 | $890 | $21,840 | $4,320 | $17,520 |
| 2015 | $893 | $21,840 | $4,320 | $17,520 |
| 2014 | $953 | $26,000 | $4,200 | $21,800 |
Source: Public Records
Map
Nearby Homes
- 6300 E Stubbs Rd
- 6445 Marsham Dr
- 6390 E Stubbs Rd
- 4145 Stonewall Tell Rd
- 6474 E Stubbs Rd
- 4060 Stonewall Tell Rd
- 3813 Stonewall Tell Rd
- 6476 Snowden Dr
- 4185 Post Oak Grove
- 6122 Marigold Way
- 6126 Marigold Way
- 3930 Demooney Rd
- 0 Derrick Rd SE Unit 22713952
- 0 Derrick Rd SE Unit 10621019
- 4369 Estate St
- 3985 Demooney Rd
- 4270 Holliday Rd
- 6070 Marigold Way
- 6078 Marigold Way
- 6082 Marigold Way
- 4000 Cranwood Dr Unit 1
- 3990 Cranwood Dr
- 4030 Cranwood Dr
- 4015 Cranwood Dr Unit 1
- 4025 Cranwood Dr
- 6290 E Stubbs Rd
- 4040 Cranwood Dr
- 6280 E Stubbs Rd
- 3995 Cranwood Dr
- 4035 Cranwood Dr
- 6420 Marsham Dr
- 4005 Cranwood Dr Unit 1
- 6310 E Stubbs Rd Unit 2
- 3975 Stonewall Tell Rd
- 4045 Cranwood Dr
- 4050 Cranwood Dr
- 3985 Stonewall Tell Rd
- 6435 Marsham Dr Unit 1
- 6430 Marsham Dr Unit 1
- 3965 Stonewall Tell Rd