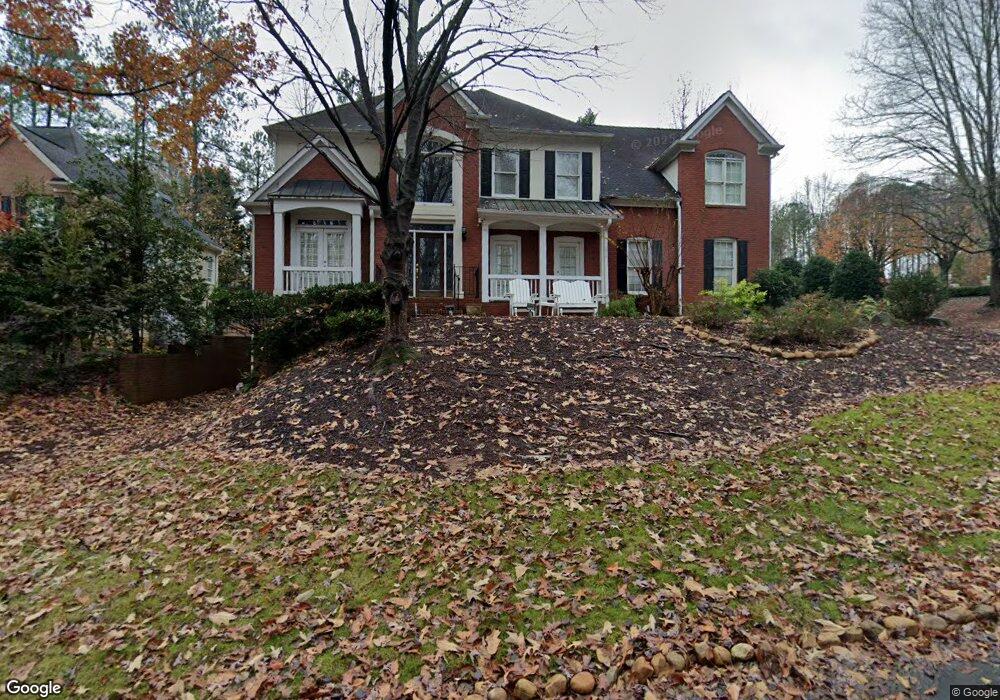
4010 Creekside Ct Alpharetta, GA 30005
Estimated Value: $694,000 - $931,000
4
Beds
4
Baths
3,578
Sq Ft
$232/Sq Ft
Est. Value
About This Home
This home is located at 4010 Creekside Ct, Alpharetta, GA 30005 and is currently estimated at $830,090, approximately $231 per square foot. 4010 Creekside Ct is a home located in Fulton County with nearby schools including Abbotts Hill Elementary School, Taylor Road Middle School, and Chattahoochee High School.
Ownership History
Date
Name
Owned For
Owner Type
Purchase Details
Closed on
Feb 27, 2023
Sold by
Pinsker Karen E
Bought by
Pinsker Craig
Current Estimated Value
Purchase Details
Closed on
Nov 30, 2004
Sold by
Prudential Relocation Inc
Bought by
Pinsker Craig and Pinsker Karen
Home Financials for this Owner
Home Financials are based on the most recent Mortgage that was taken out on this home.
Original Mortgage
$50,000
Interest Rate
5.67%
Mortgage Type
New Conventional
Purchase Details
Closed on
May 2, 2002
Sold by
Wells Fargo Bank West Na
Bought by
Allen Robert C and Allen Kay B
Purchase Details
Closed on
Dec 27, 2001
Sold by
Monroe Maria A and Monroe Garland A
Bought by
Allen Robert C and Allen Kay B
Home Financials for this Owner
Home Financials are based on the most recent Mortgage that was taken out on this home.
Original Mortgage
$60,000
Interest Rate
6.72%
Mortgage Type
New Conventional
Purchase Details
Closed on
Mar 7, 1995
Sold by
Ashton Woods Atlanta Jv
Bought by
Monroe Garland A
Create a Home Valuation Report for This Property
The Home Valuation Report is an in-depth analysis detailing your home's value as well as a comparison with similar homes in the area
Home Values in the Area
Average Home Value in this Area
Purchase History
| Date | Buyer | Sale Price | Title Company |
|---|---|---|---|
| Pinsker Craig | -- | -- | |
| Pinsker Craig | $325,000 | -- | |
| Prudential Relocation Inc | $338,000 | -- | |
| Allen Robert C | -- | -- | |
| Allen Robert C | $330,000 | -- | |
| Monroe Garland A | $270,000 | -- |
Source: Public Records
Mortgage History
| Date | Status | Borrower | Loan Amount |
|---|---|---|---|
| Previous Owner | Prudential Relocation Inc | $50,000 | |
| Previous Owner | Prudential Relocation Inc | $258,700 | |
| Previous Owner | Allen Robert C | $60,000 | |
| Closed | Monroe Garland A | $0 |
Source: Public Records
Tax History Compared to Growth
Tax History
| Year | Tax Paid | Tax Assessment Tax Assessment Total Assessment is a certain percentage of the fair market value that is determined by local assessors to be the total taxable value of land and additions on the property. | Land | Improvement |
|---|---|---|---|---|
| 2025 | $4,865 | $305,280 | $89,480 | $215,800 |
| 2023 | $8,593 | $304,440 | $71,040 | $233,400 |
| 2022 | $4,672 | $258,960 | $47,320 | $211,640 |
| 2021 | $4,611 | $196,760 | $34,200 | $162,560 |
| 2020 | $4,646 | $191,160 | $38,360 | $152,800 |
| 2019 | $552 | $187,800 | $37,680 | $150,120 |
| 2018 | $5,296 | $183,400 | $36,800 | $146,600 |
| 2017 | $4,478 | $143,720 | $26,600 | $117,120 |
| 2016 | $4,405 | $143,720 | $26,600 | $117,120 |
| 2015 | $4,453 | $143,720 | $26,600 | $117,120 |
| 2014 | $4,609 | $143,720 | $26,600 | $117,120 |
Source: Public Records
Map
Nearby Homes
- 5575 Ashwind Trace
- 11615 Windbrooke Way
- 5610 N Hillbrooke Trace
- 11835 Leeward Walk Cir
- 5200 Cresslyn Ridge
- 1660 Gladewood Dr
- 335 Dunhill Way Ct
- 1895 Oak Tree Hollow
- 12205 Stevens Creek Dr
- 5785 Oxborough Way Unit 1
- 775 Ellsborough Ct
- 11420 Crossington Rd
- 130 Wyndlam Ct
- 5455 Woodrun Ln
- 5145 Southlake Dr
- 11619 Davenport Ln
- 4020 Creekside Ct
- 0 Creekside Ct Unit 7317352
- 0 Creekside Ct
- 4030 Creekside Ct
- 3050 Lakeside Ct
- 3050 Lakeside Ct Unit 3050
- 11845 Windbrooke Way Unit 1
- 4040 Creekside Ct
- 5545 Lexington Woods Ln
- 5535 Lexington Woods Ln
- 5525 Lexington Woods Ln
- 3040 Lakeside Ct Unit 3040
- 3040 Lakeside Ct
- 160 Windview Place
- 11850 Windbrooke Way
- 0 Lakeside Ct Unit 3220540
- 0 Lakeside Ct Unit 8002921
- 0 Lakeside Ct Unit 7006156
- 0 Lakeside Ct Unit 3145005
- 5515 Lexington Woods Ln