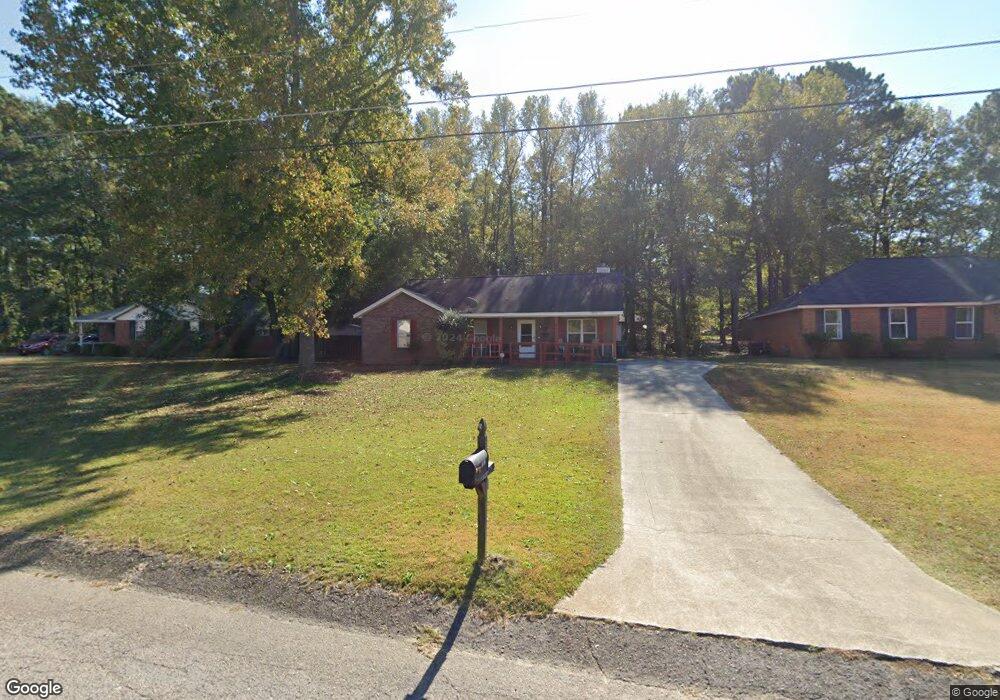
4010 Foreman Ct Hephzibah, GA 30815
Richmond Factory NeighborhoodEstimated Value: $181,094 - $228,000
3
Beds
2
Baths
1,450
Sq Ft
$137/Sq Ft
Est. Value
About This Home
This home is located at 4010 Foreman Ct, Hephzibah, GA 30815 and is currently estimated at $199,274, approximately $137 per square foot. 4010 Foreman Ct is a home located in Richmond County with nearby schools including Willis Foreman Elementary School, Hephzibah Middle School, and Johnson Magnet.
Ownership History
Date
Name
Owned For
Owner Type
Purchase Details
Closed on
May 31, 2006
Sold by
Coleman Anthony S and Coleman Doreen O
Bought by
Rogers Candace L
Current Estimated Value
Home Financials for this Owner
Home Financials are based on the most recent Mortgage that was taken out on this home.
Original Mortgage
$7,500
Interest Rate
6.51%
Mortgage Type
Stand Alone Second
Purchase Details
Closed on
Sep 15, 1994
Sold by
Sunbelt Homes Inc
Bought by
Coleman Anthony S
Purchase Details
Closed on
Jun 1, 1992
Sold by
Resolution Trust Co
Bought by
Mccumbers Kenneth
Purchase Details
Closed on
May 26, 1992
Sold by
Trio Developers Inc
Bought by
Resolution Trust Co
Create a Home Valuation Report for This Property
The Home Valuation Report is an in-depth analysis detailing your home's value as well as a comparison with similar homes in the area
Home Values in the Area
Average Home Value in this Area
Purchase History
| Date | Buyer | Sale Price | Title Company |
|---|---|---|---|
| Rogers Candace L | $91,423 | None Available | |
| Rogers Candice L | $98,000 | -- | |
| Coleman Anthony S | $68,900 | -- | |
| Mccumbers Kenneth | $420,000 | -- | |
| Resolution Trust Co | -- | -- |
Source: Public Records
Mortgage History
| Date | Status | Borrower | Loan Amount |
|---|---|---|---|
| Previous Owner | Rogers Candice L | $7,500 | |
| Previous Owner | Rogers Candice L | $91,423 |
Source: Public Records
Tax History Compared to Growth
Tax History
| Year | Tax Paid | Tax Assessment Tax Assessment Total Assessment is a certain percentage of the fair market value that is determined by local assessors to be the total taxable value of land and additions on the property. | Land | Improvement |
|---|---|---|---|---|
| 2025 | $470 | $68,192 | $3,800 | $64,392 |
| 2024 | $470 | $59,832 | $3,800 | $56,032 |
| 2023 | $406 | $57,484 | $3,800 | $53,684 |
| 2022 | $396 | $42,876 | $3,800 | $39,076 |
| 2021 | $396 | $33,093 | $3,800 | $29,293 |
| 2020 | $396 | $29,784 | $3,420 | $26,364 |
| 2019 | $396 | $29,784 | $3,420 | $26,364 |
| 2018 | $396 | $29,784 | $3,420 | $26,364 |
| 2017 | $359 | $29,784 | $3,420 | $26,364 |
| 2016 | $359 | $29,784 | $3,420 | $26,364 |
| 2015 | $360 | $29,784 | $3,420 | $26,364 |
| 2014 | $361 | $29,784 | $3,420 | $26,364 |
Source: Public Records
Map
Nearby Homes
- 1010 Aldrich St
- 1026 Aldrich St
- 1005 Aldrich St
- 1012 Aldrich St
- Balsa 25 Plan at Knox Place
- 1020 Aldrich St
- 1007 Aldrich St
- 1009 Megan Ln
- 2369 Plantation Rd
- 2369a Plantation Rd
- 117 Barefield Dr
- 4520 Windsor Spring Rd
- 2323 Woodsman Dr
- 4249 Rheney Rd
- 102 Barefield Dr
- 2264 Nellie Dr
- 1012 Rosendale Dr
- 1016 Rosendale Dr
- 1018 Rosendale Dr
- 2348 Fieldcrest Rd
- 4008 Foreman Ct
- 4012 Foreman Ct
- 4006 Foreman Ct
- 4014 Foreman Ct
- 2349 Willis Foreman Rd
- 2351 Willis Foreman Rd
- 4003 Foreman Ct
- 4005 Foreman Ct
- 4004 Foreman Ct
- 2345 Willis Foreman Rd
- 2353 Willis Foreman Rd
- 4016 Foreman Ct
- 4106 Foreman Way
- 4007 Foreman Ct
- 2355 Willis Foreman Rd
- 4104 Foreman Way
- 4018 Foreman Ct
- 4108 Foreman Way
- 4075 Ruffin Rd
- 2357 Willis Foreman Rd