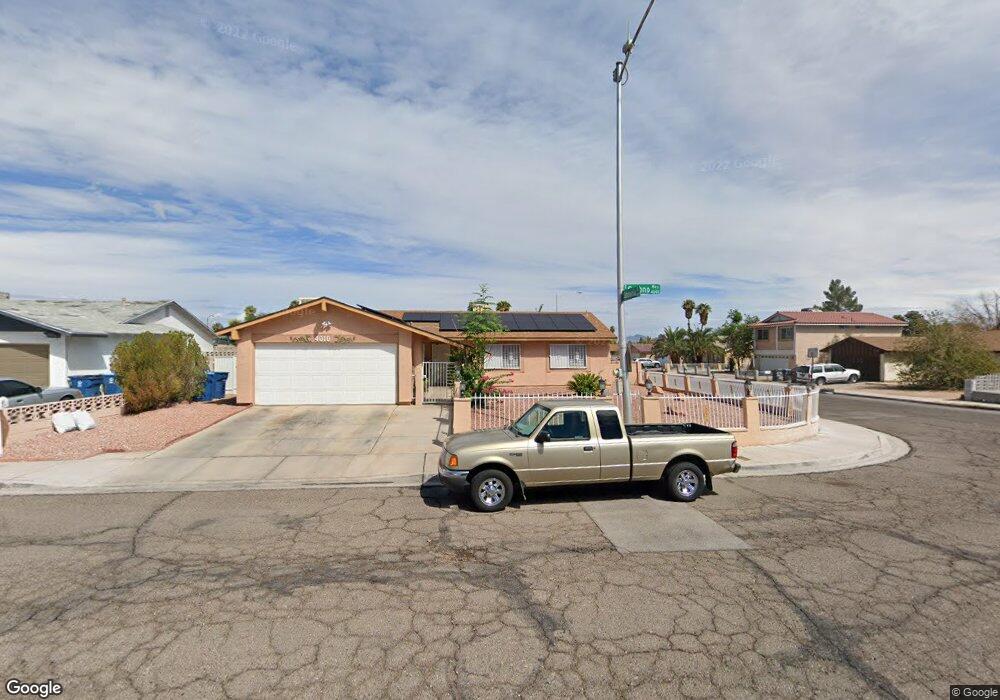
4010 Garono Way Las Vegas, NV 89104
Estimated Value: $296,000 - $437,000
4
Beds
2
Baths
1,408
Sq Ft
$256/Sq Ft
Est. Value
About This Home
This home is located at 4010 Garono Way, Las Vegas, NV 89104 and is currently estimated at $360,195, approximately $255 per square foot. 4010 Garono Way is a home located in Clark County with nearby schools including Walter V. Long Elementary School, Jerome Mack Middle School, and Desert Pines High School.
Ownership History
Date
Name
Owned For
Owner Type
Purchase Details
Closed on
Jan 15, 2019
Sold by
Angat Hernando L and Angat Cleotilde M
Bought by
Gonzales Maximo and Gonzales Ursula
Current Estimated Value
Purchase Details
Closed on
Jun 6, 2012
Sold by
Gonzales Maximo S and Gonzales Ursula M
Bought by
Angat Hernando L and Angat Cleotilde M
Purchase Details
Closed on
Jul 21, 1997
Sold by
Robson William Bryce
Bought by
Gonzales Maximo S and Gonzales Ursula M
Home Financials for this Owner
Home Financials are based on the most recent Mortgage that was taken out on this home.
Original Mortgage
$87,600
Interest Rate
9%
Purchase Details
Closed on
Jan 3, 1995
Sold by
Robson William Bryce
Bought by
Robson William Bryce and Robson Toshiko
Home Financials for this Owner
Home Financials are based on the most recent Mortgage that was taken out on this home.
Original Mortgage
$14,250
Interest Rate
9.27%
Create a Home Valuation Report for This Property
The Home Valuation Report is an in-depth analysis detailing your home's value as well as a comparison with similar homes in the area
Home Values in the Area
Average Home Value in this Area
Purchase History
| Date | Buyer | Sale Price | Title Company |
|---|---|---|---|
| Gonzales Maximo | $125,243 | None Available | |
| Angat Hernando L | $71,350 | Lawyers Title Of Nevada Cha | |
| Gonzales Maximo S | $109,500 | First American Title Co | |
| Robson William Bryce | -- | United Title |
Source: Public Records
Mortgage History
| Date | Status | Borrower | Loan Amount |
|---|---|---|---|
| Previous Owner | Gonzales Maximo S | $87,600 | |
| Previous Owner | Robson William Bryce | $14,250 |
Source: Public Records
Tax History Compared to Growth
Tax History
| Year | Tax Paid | Tax Assessment Tax Assessment Total Assessment is a certain percentage of the fair market value that is determined by local assessors to be the total taxable value of land and additions on the property. | Land | Improvement |
|---|---|---|---|---|
| 2025 | $849 | $54,648 | $27,300 | $27,348 |
| 2024 | $824 | $54,648 | $27,300 | $27,348 |
| 2023 | $824 | $56,731 | $29,750 | $26,981 |
| 2022 | $801 | $49,568 | $24,500 | $25,068 |
| 2021 | $777 | $45,294 | $21,000 | $24,294 |
| 2020 | $752 | $45,165 | $20,650 | $24,515 |
| 2019 | $730 | $43,835 | $19,250 | $24,585 |
| 2018 | $709 | $39,667 | $15,750 | $23,917 |
| 2017 | $1,130 | $38,529 | $14,000 | $24,529 |
| 2016 | $665 | $35,511 | $10,150 | $25,361 |
| 2015 | $662 | $30,791 | $7,700 | $23,091 |
| 2014 | $641 | $24,138 | $5,600 | $18,538 |
Source: Public Records
Map
Nearby Homes
- 4057 Olive St
- 4067 E Colorado Ave
- 3887 Delling Ct
- 4055 E New York Ave
- 1892 Miner Way
- 1944 Randa Ln
- 3724 Lanai Ave
- 1601 S Sandhill Rd Unit 78
- 1601 S Sandhill Rd Unit 191
- 4324 E Saint Louis Ave
- 4217 Park Ct
- 45 Prince Ln
- 4213 Essex Green Ct
- 49 Del Amo Dr
- 4201 Essex Green Ct
- 4170 E Baltimore Ave
- 4214 E Baltimore Ave
- 4280 Hampshire Green Ct
- 4458 Skyview Dr
- 2278 Miner Way
- 3998 Garono Way
- 1557 Jaboneria Dr
- 1572 Jaboneria Dr
- 1588 Jaboneria Dr
- 3986 Garono Way
- 4011 Garono Way
- 1541 Jaboneria Dr
- 1556 Calabria Dr
- 3999 Garono Way
- 1558 Jaboneria Dr
- 4023 Garono Way
- 3987 Garono Way
- 1606 Jaboneria Dr
- 1540 Calabria Dr
- 1542 Jaboneria Dr
- 1525 Jaboneria Dr
- 3975 Garono Way
- 1573 Gateway Ave
- 1589 Gateway Ave
- 1559 Gateway Ave