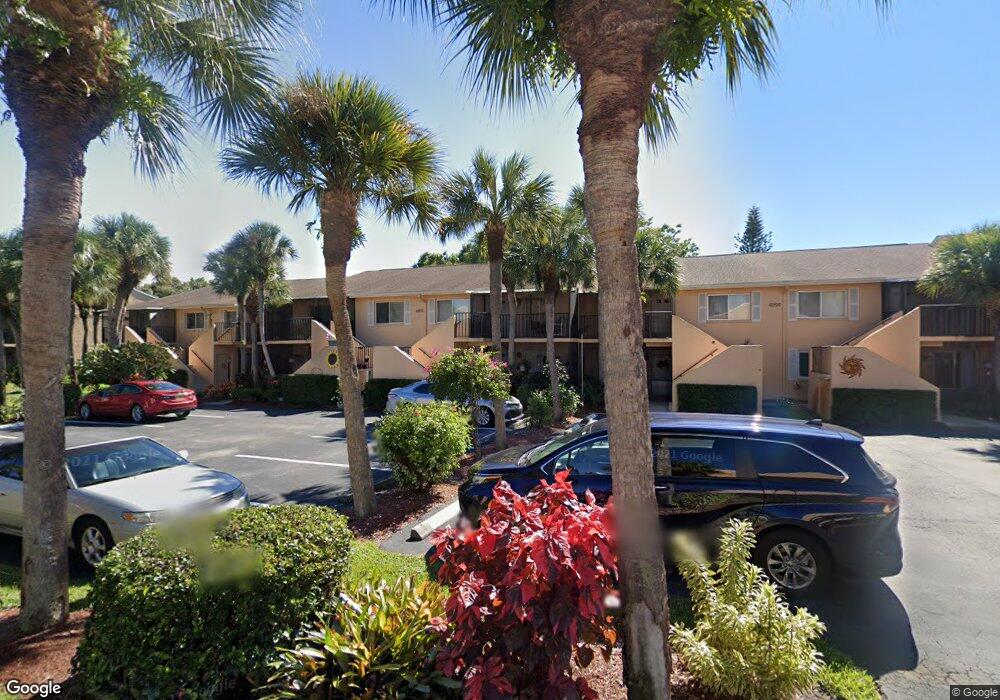
4010 Ice Castle Way Unit 2609 Naples, FL 34112
East Naples NeighborhoodEstimated Value: $242,000 - $284,000
--
Bed
--
Bath
1,246
Sq Ft
$205/Sq Ft
Est. Value
About This Home
This home is located at 4010 Ice Castle Way Unit 2609, Naples, FL 34112 and is currently estimated at $255,180, approximately $204 per square foot. 4010 Ice Castle Way Unit 2609 is a home located in Collier County with nearby schools including Shadowlawn Elementary School, Naples High School, and East Naples Middle School.
Ownership History
Date
Name
Owned For
Owner Type
Purchase Details
Closed on
Jun 30, 2015
Sold by
Branchi Nirka and Uribe Luz A
Bought by
Uribe Luz A
Current Estimated Value
Purchase Details
Closed on
Jun 1, 2015
Bought by
Uribe Luz A
Purchase Details
Closed on
Aug 9, 2002
Sold by
Pereira Manuel C and Pereira Maria R
Bought by
Branchi Nirka and Uribe Luz A
Home Financials for this Owner
Home Financials are based on the most recent Mortgage that was taken out on this home.
Original Mortgage
$94,090
Interest Rate
6.52%
Mortgage Type
FHA
Purchase Details
Closed on
Mar 2, 2001
Sold by
Stein Howard J and Stein Arline
Bought by
Cooke Patrick P
Home Financials for this Owner
Home Financials are based on the most recent Mortgage that was taken out on this home.
Original Mortgage
$60,000
Interest Rate
7.12%
Mortgage Type
Purchase Money Mortgage
Create a Home Valuation Report for This Property
The Home Valuation Report is an in-depth analysis detailing your home's value as well as a comparison with similar homes in the area
Home Values in the Area
Average Home Value in this Area
Purchase History
| Date | Buyer | Sale Price | Title Company |
|---|---|---|---|
| Uribe Luz A | -- | Attorney | |
| Uribe Luz A | $100 | -- | |
| Branchi Nirka | $97,000 | -- | |
| Cooke Patrick P | $75,000 | -- |
Source: Public Records
Mortgage History
| Date | Status | Borrower | Loan Amount |
|---|---|---|---|
| Previous Owner | Branchi Nirka | $94,090 | |
| Previous Owner | Cooke Patrick P | $60,000 |
Source: Public Records
Tax History Compared to Growth
Tax History
| Year | Tax Paid | Tax Assessment Tax Assessment Total Assessment is a certain percentage of the fair market value that is determined by local assessors to be the total taxable value of land and additions on the property. | Land | Improvement |
|---|---|---|---|---|
| 2025 | $1,926 | $224,312 | -- | $224,312 |
| 2024 | $2,025 | $230,542 | -- | $230,542 |
| 2023 | $2,025 | $236,018 | $0 | $236,018 |
| 2022 | $1,888 | $158,466 | $0 | $0 |
| 2021 | $1,645 | $144,060 | $0 | $144,060 |
| 2020 | $1,559 | $137,830 | $0 | $137,830 |
| 2019 | $1,542 | $135,338 | $0 | $135,338 |
| 2018 | $1,468 | $129,108 | $0 | $129,108 |
| 2017 | $1,433 | $124,760 | $0 | $0 |
| 2016 | $1,305 | $113,418 | $0 | $0 |
| 2015 | $530 | $83,650 | $0 | $0 |
| 2014 | $529 | $32,986 | $0 | $0 |
Source: Public Records
Map
Nearby Homes
- 4021 Ice Castle Way Unit 3407
- 4031 Ice Castle Way Unit 3303
- 4092 Northlight Dr Unit 1707
- 4040 Ice Castle Way Unit 2802
- 4040 Ice Castle Way Unit 2807
- 191 Round Key Cir Unit D-2
- 183 Round Key Cir Unit D4
- 4802 Lakewood Blvd
- 178 Round Key Cir Unit G22
- 4030 Northlight Dr
- 4070 Looking Glass Ln Unit 3101
- 4650 Chippendale Dr
- 3832 Snowflake Ln Unit 1207
- 4150 Looking Glass Ln Unit 5
- 4616 Chippendale Dr
- 4180 Looking Glass Ln Unit 4108
- 107 Round Key Cir Unit E-9
- 4010 Ice Castle Way Unit 5
- 4010 Ice Castle Way Unit 7
- 4010 Ice Castle Way Unit 2616
- 4010 Ice Castle Way Unit 2615
- 4010 Ice Castle Way Unit 2614
- 4010 Ice Castle Way Unit 2613
- 4010 Ice Castle Way Unit 2612
- 4010 Ice Castle Way Unit 2611
- 4010 Ice Castle Way Unit 2610
- 4010 Ice Castle Way Unit 8
- 4001 Ice Castle Way Unit 7
- 4001 Ice Castle Way Unit 1
- 4001 Ice Castle Way Unit 6
- 4001 Ice Castle Way Unit 10
- 4001 Ice Castle Way Unit 3610
- 4001 Ice Castle Way Unit 3609
- 4001 Ice Castle Way Unit 3607
- 4001 Ice Castle Way Unit 3606
- 4001 Ice Castle Way Unit 3605
- 4001 Ice Castle Way Unit 3604