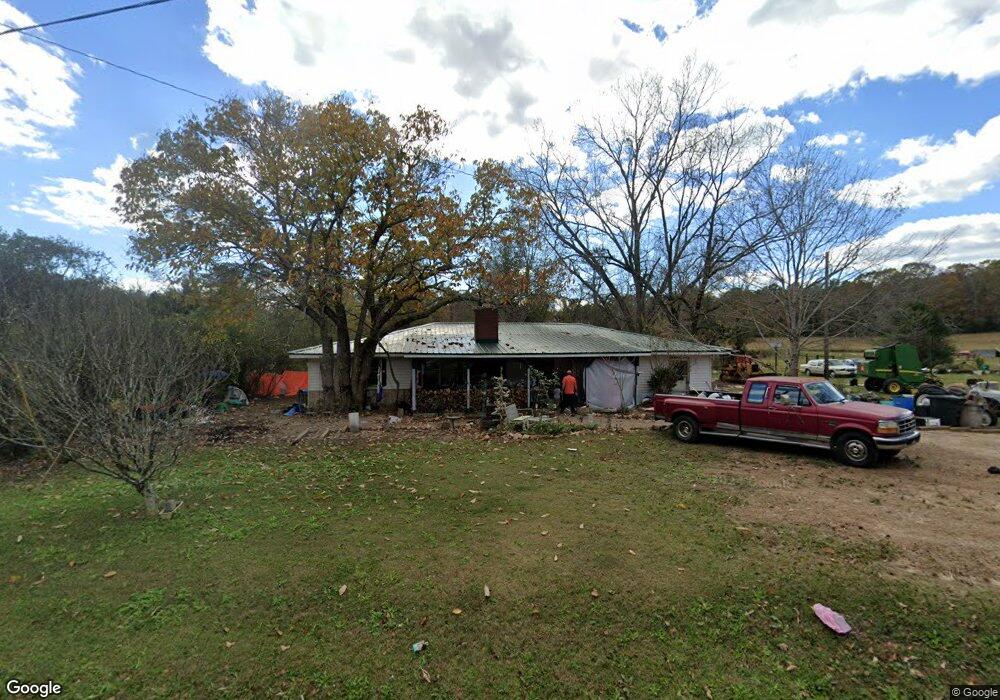
4010 Kings Gap Rd Shiloh, GA 31826
Estimated Value: $260,000 - $663,322
3
Beds
1
Bath
1,920
Sq Ft
$240/Sq Ft
Est. Value
About This Home
This home is located at 4010 Kings Gap Rd, Shiloh, GA 31826 and is currently estimated at $461,661, approximately $240 per square foot. 4010 Kings Gap Rd is a home located in Harris County with nearby schools including Park Elementary School, Harris County Carver Middle School, and Creekside School.
Ownership History
Date
Name
Owned For
Owner Type
Purchase Details
Closed on
Dec 31, 2024
Sold by
Morgan Stanley
Bought by
Reynolds Charles Coleman
Current Estimated Value
Purchase Details
Closed on
Jul 3, 2024
Sold by
Reynolds Charles C
Bought by
Property Financial Group Llc
Purchase Details
Closed on
Jun 28, 2024
Sold by
Reynolds Charles Coleman
Bought by
Morgan Stanley
Purchase Details
Closed on
Jan 31, 2024
Sold by
Chapman Debbie Tresa Reynolds
Bought by
Reynolds Charles Coleman
Purchase Details
Closed on
Sep 14, 2022
Sold by
Reynolds Charles C
Bought by
Chapman Debbie Tresa Reynolds
Purchase Details
Closed on
Apr 2, 2013
Sold by
Reynolds Johnnie C
Bought by
Reynolds Charles C and Chapman Debbie Tresa
Purchase Details
Closed on
Mar 26, 2007
Sold by
Reynolds J C
Bought by
Reynolds J C J and Reynolds Ruby J
Create a Home Valuation Report for This Property
The Home Valuation Report is an in-depth analysis detailing your home's value as well as a comparison with similar homes in the area
Purchase History
| Date | Buyer | Sale Price | Title Company |
|---|---|---|---|
| Reynolds Charles Coleman | -- | -- | |
| Property Financial Group Llc | $10,000 | -- | |
| Morgan Stanley | $5,000 | -- | |
| Reynolds Charles Coleman | -- | -- | |
| Chapman Debbie Tresa Reynolds Tr | -- | -- | |
| Chapman Debbie Tresa Reynolds Tr | -- | -- | |
| Chapman Debbie Tresa Reynolds | -- | -- | |
| Reynolds Charles C | -- | -- | |
| Reynolds J C J | -- | -- |
Source: Public Records
Tax History
| Year | Tax Paid | Tax Assessment Tax Assessment Total Assessment is a certain percentage of the fair market value that is determined by local assessors to be the total taxable value of land and additions on the property. | Land | Improvement |
|---|---|---|---|---|
| 2025 | $524 | $108,019 | $103,928 | $4,091 |
| 2024 | $2,952 | $179,664 | $137,682 | $41,982 |
| 2023 | $2,923 | $179,664 | $137,682 | $41,982 |
| 2022 | $3,324 | $200,982 | $159,000 | $41,982 |
| 2021 | $3,354 | $199,876 | $159,000 | $40,876 |
| 2020 | $3,312 | $199,876 | $159,000 | $40,876 |
| 2019 | $3,174 | $199,876 | $159,000 | $40,876 |
| 2018 | $3,188 | $199,876 | $159,000 | $40,876 |
| 2017 | $3,107 | $153,909 | $113,033 | $40,876 |
| 2016 | $2,937 | $279,926 | $238,957 | $40,970 |
| 2015 | -- | $279,926 | $238,957 | $40,970 |
| 2013 | -- | $0 | $0 | $0 |
Source: Public Records
Map
Nearby Homes
- 19110 Ga Highway 116
- 1251 S L St
- 2136 Hines Gap Rd
- 521 Cedar Dr W
- 299 S L St
- 21401 Ga Highway 116
- 2.83 ACRES Williams Rd
- 0 Royal Lodge Cir Unit 231125
- 0 Brown Creek Rd Unit 10702900
- 207 Westgate Cir
- 723 Brown Creek Rd
- 2.03 Acres Johnson Mill Rd
- 180.14 Ac Johnson Mill Rd
- 2.03 AC Johnson Mill Rd
- 180.14 Johnson Mill Rd
- 180.14 AC Johnson Mill Rd
- 2083 Johnson Mill Rd
- 520 Copeland Rd
- 17081 Ga Highway 85 W
- 000 Brown Creek Rd
- 4228 Kings Gap Rd
- 49 Jc Reynolds Rd
- 190 Jc Reynolds Rd
- 4331 Kings Gap Rd
- J Jc Reynolds Rd
- 341 Jc Reynolds Rd
- 1826 H St
- 1930 H St
- 466 Jc Reynolds Rd
- 3778 Kings Gap Rd
- 4659 Kings Gap Rd
- 1870 H St
- 512 Jc Reynolds Rd
- 638 Reynolds Rd W
- 634 Jc Reynolds Rd
- 29 Trammell Mill Rd
- 642 Jc Reynolds Rd
- 3570 Kings Gap Rd
- 3595 Kings Gap Rd
- 380 Trammell Mill Rd
Your Personal Tour Guide
Ask me questions while you tour the home.