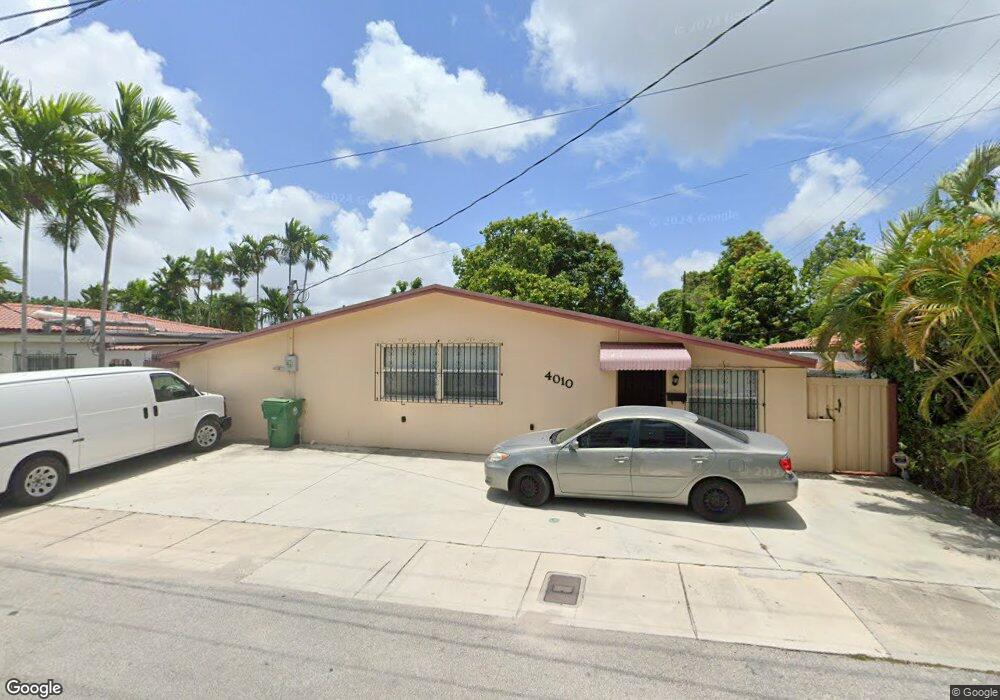
4010 NW 11th St Miami, FL 33126
West Flagler NeighborhoodEstimated Value: $467,952 - $650,000
3
Beds
2
Baths
1,269
Sq Ft
$424/Sq Ft
Est. Value
About This Home
This home is located at 4010 NW 11th St, Miami, FL 33126 and is currently estimated at $538,238, approximately $424 per square foot. 4010 NW 11th St is a home located in Miami-Dade County with nearby schools including Kinloch Park Elementary School, Kinloch Park Middle School, and Coral Gables Senior High School.
Ownership History
Date
Name
Owned For
Owner Type
Purchase Details
Closed on
Oct 2, 2015
Sold by
Jabid Investments Corporation
Bought by
The Pablo J Brito & Lidia Brito Revocabl
Current Estimated Value
Purchase Details
Closed on
Dec 3, 2010
Sold by
Fannie Mae
Bought by
Jabid Investments Corp
Purchase Details
Closed on
Feb 6, 2010
Sold by
Eguiluz Blanca and Eguiluz Rene
Bought by
Fannie Mae
Purchase Details
Closed on
Mar 17, 2004
Sold by
Lavilla Silvia and Lavilla Silvia Juana
Bought by
Eguiluz Rene and Eguiluz Blanca
Home Financials for this Owner
Home Financials are based on the most recent Mortgage that was taken out on this home.
Original Mortgage
$200,500
Interest Rate
6.99%
Mortgage Type
Unknown
Purchase Details
Closed on
Mar 24, 2000
Sold by
Villa Miguel A and Lavilla Silvia La
Bought by
La Villa Silvia J
Create a Home Valuation Report for This Property
The Home Valuation Report is an in-depth analysis detailing your home's value as well as a comparison with similar homes in the area
Home Values in the Area
Average Home Value in this Area
Purchase History
| Date | Buyer | Sale Price | Title Company |
|---|---|---|---|
| The Pablo J Brito & Lidia Brito Revocabl | -- | Attorney | |
| Jabid Investments Corp | $68,000 | Reo Title Company Of Fl Llc | |
| Fannie Mae | $257,100 | Attorney | |
| Eguiluz Rene | $200,500 | Titles Unlimited Inc | |
| La Villa Silvia J | $13,000 | -- |
Source: Public Records
Mortgage History
| Date | Status | Borrower | Loan Amount |
|---|---|---|---|
| Previous Owner | Eguiluz Rene | $200,500 |
Source: Public Records
Tax History Compared to Growth
Tax History
| Year | Tax Paid | Tax Assessment Tax Assessment Total Assessment is a certain percentage of the fair market value that is determined by local assessors to be the total taxable value of land and additions on the property. | Land | Improvement |
|---|---|---|---|---|
| 2025 | $5,680 | $267,902 | -- | -- |
| 2024 | $5,054 | $243,548 | -- | -- |
| 2023 | $5,054 | $221,408 | $0 | $0 |
| 2022 | $4,668 | $201,280 | $0 | $0 |
| 2021 | $4,268 | $182,982 | $81,983 | $100,999 |
| 2020 | $4,261 | $183,109 | $81,983 | $101,126 |
| 2019 | $4,036 | $183,237 | $81,983 | $101,254 |
| 2018 | $3,596 | $160,559 | $73,626 | $86,933 |
| 2017 | $3,289 | $136,570 | $0 | $0 |
| 2016 | $3,040 | $121,852 | $0 | $0 |
| 2015 | $2,789 | $103,439 | $0 | $0 |
| 2014 | $2,513 | $94,036 | $0 | $0 |
Source: Public Records
Map
Nearby Homes
- 821 NW 40th Ave
- 3840 NW 12th Terrace
- 511 NW 39th Ave
- 750 NW 43rd Ave Unit 610
- 3915 NW 4th Terrace
- 0 NW 42nd Ave
- 4421 NW 9th St
- 3640 NW 9th St Unit 407
- 3640 NW 9th St Unit 105
- 300 NW 42nd Ave Unit 109
- 270 NW 40th Ct
- 225 NW 40th Ct
- 4550 NW 9th St Unit 520E
- 4550 NW 9th St Unit 106E
- 3500 NW 12th St
- 420 NW 44th Ave
- 3680 NW 16th St
- Fluvia & NW Le Jeune Rd
- 4677 NW 9th St Unit 102
- 3801 NW 2nd St
- 1020 NW 40th Ave
- 1010 NW 40th Ave
- 1021 NW 41st Ave
- 1011 NW 41st Ave
- 1000 NW 40th Ave
- 1001 NW 41st Ave
- 960 NW 40th Ave
- 961 NW 41st Ave
- 1031 NW 40th Ave
- 950 NW 40th Ave
- 1021 NW 40th Ave
- 951 NW 41st Ave
- 1011 NW 40th Ave Unit 2
- 1011 NW 40th Ave
- 1020 NW 41st Ave
- 940 NW 40th Ave
- 941 NW 41st Ave
- 1000 NW 41st Ave