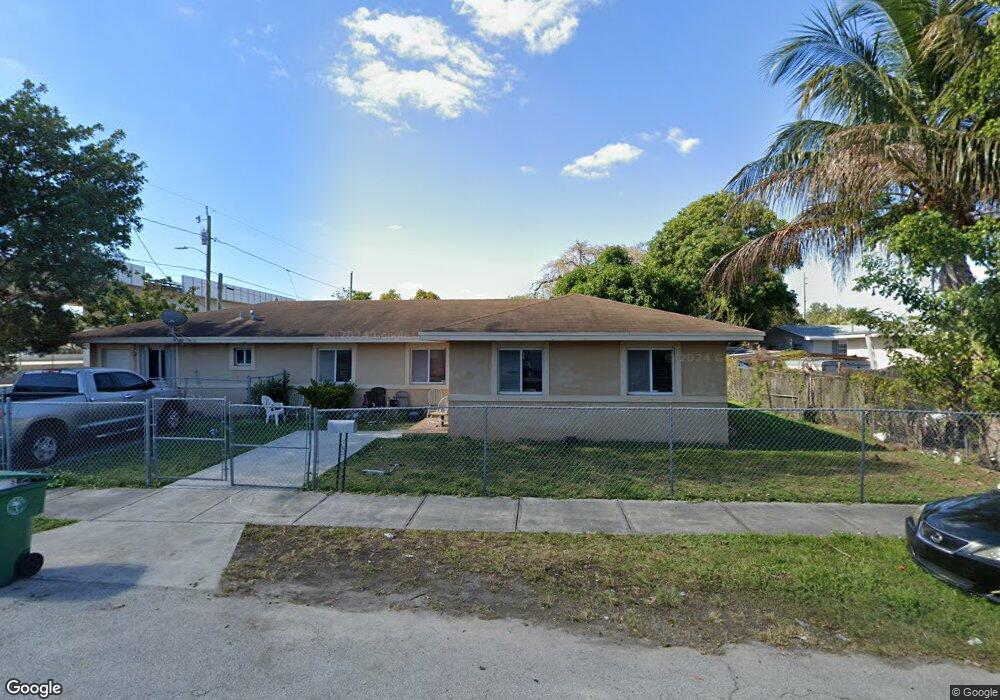
4010 NW 14th Ave Miami, FL 33142
Liberty City NeighborhoodEstimated Value: $608,099 - $803,000
5
Beds
3
Baths
2,231
Sq Ft
$311/Sq Ft
Est. Value
About This Home
This home is located at 4010 NW 14th Ave, Miami, FL 33142 and is currently estimated at $693,025, approximately $310 per square foot. 4010 NW 14th Ave is a home located in Miami-Dade County with nearby schools including Lenora Braynon Smith Elementary School, Georgia Jones Ayers Middle School, and Miami Jackson Senior High School.
Ownership History
Date
Name
Owned For
Owner Type
Purchase Details
Closed on
Nov 4, 2020
Sold by
Vega Freddy A and Vega Lidia M
Bought by
Vega Lidia M and Vega Olga M
Current Estimated Value
Purchase Details
Closed on
Jul 27, 2006
Sold by
Alco Group Inc
Bought by
Vega Freddy A and Vega Lidia M
Home Financials for this Owner
Home Financials are based on the most recent Mortgage that was taken out on this home.
Original Mortgage
$296,000
Outstanding Balance
$178,773
Interest Rate
6.87%
Mortgage Type
Unknown
Estimated Equity
$514,252
Purchase Details
Closed on
Jul 18, 2005
Sold by
Mortgage Investments Corp
Bought by
Alco Group Inc
Purchase Details
Closed on
Apr 7, 2005
Sold by
County Of Miami Dade
Bought by
Alco Group Inc
Purchase Details
Closed on
Oct 20, 2004
Sold by
Baker John Henry and Baker Emmie L
Bought by
Mortgage Investments Corp
Create a Home Valuation Report for This Property
The Home Valuation Report is an in-depth analysis detailing your home's value as well as a comparison with similar homes in the area
Home Values in the Area
Average Home Value in this Area
Purchase History
| Date | Buyer | Sale Price | Title Company |
|---|---|---|---|
| Vega Lidia M | -- | None Available | |
| Vega Freddy A | $370,000 | Attorney | |
| Alco Group Inc | -- | -- | |
| Alco Group Inc | $29,300 | -- | |
| Mortgage Investments Corp | $15,000 | -- |
Source: Public Records
Mortgage History
| Date | Status | Borrower | Loan Amount |
|---|---|---|---|
| Open | Vega Freddy A | $296,000 |
Source: Public Records
Tax History Compared to Growth
Tax History
| Year | Tax Paid | Tax Assessment Tax Assessment Total Assessment is a certain percentage of the fair market value that is determined by local assessors to be the total taxable value of land and additions on the property. | Land | Improvement |
|---|---|---|---|---|
| 2025 | $10,248 | $446,644 | $222,000 | $224,644 |
| 2024 | $9,557 | $470,747 | -- | -- |
| 2023 | $9,557 | $427,952 | $197,834 | $230,118 |
| 2022 | $9,231 | $389,900 | $0 | $0 |
| 2021 | $8,291 | $354,455 | $131,890 | $222,565 |
| 2020 | $6,022 | $326,831 | $101,678 | $225,153 |
| 2019 | $5,618 | $305,954 | $78,214 | $227,740 |
| 2018 | $4,925 | $257,621 | $51,120 | $206,501 |
| 2017 | $4,709 | $155,477 | $0 | $0 |
| 2016 | $4,488 | $141,343 | $0 | $0 |
| 2015 | $3,874 | $128,494 | $0 | $0 |
| 2014 | $3,694 | $116,813 | $0 | $0 |
Source: Public Records
Map
Nearby Homes
- 1411 NW 40th St
- 1411 NW 41st St
- 1394 NW 42nd St
- 4001 NW 15th Ave
- 1355 NW 42nd St
- 1310 NW 42nd St
- 4760 NW 16th Ave
- 1304 NW 43rd St
- 1300 NW 43rd St
- 1419 NW 44th St
- 1629 NW 40th St
- 1271 NW 38th St
- 1321 NW 44th St
- 1250 NW 43rd St
- 4901 - 4923 NW 17th Ave
- 1240 NW 38th St
- 1243 NW 42nd St
- 3817 NW 17th Ave Unit 10
- 1218 NW 41st St
- 1629 NW 43rd St
- 1401 NW 40th St
- 1400 NW 41st St
- 1421 NW 40th St
- 1414 NW 41st St
- 1420 NW 41st St Unit 1
- 1420 NW 41st St
- 1395 NW 40th St
- 1394 NW 41st St
- 1429 NW 40th St
- 1377 NW 40th St
- 1426 NW 41st St
- 1376 NW 41st St
- 1435 NW 40th St
- 1369 NW 40th St
- 1430 NW 41st St
- 1368 NW 41st St
- 1445 NW 40th St
- 1411 NW 41st St Unit 1413
- 4100 NW 14th Ave