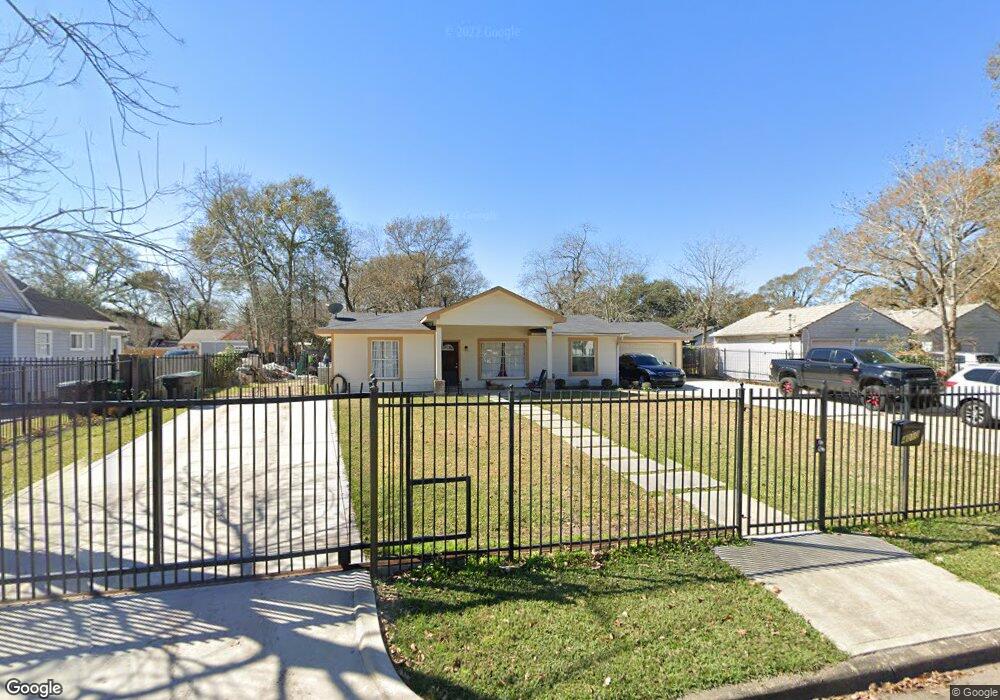
4010 River Dr Houston, TX 77017
Park Place NeighborhoodEstimated Value: $273,059 - $302,000
4
Beds
3
Baths
1,775
Sq Ft
$161/Sq Ft
Est. Value
About This Home
This home is located at 4010 River Dr, Houston, TX 77017 and is currently estimated at $286,015, approximately $161 per square foot. 4010 River Dr is a home located in Harris County with nearby schools including Park Place Elementary School, Daniel Ortiz Middle School, and Chavez High School.
Ownership History
Date
Name
Owned For
Owner Type
Purchase Details
Closed on
Mar 22, 2002
Sold by
Campos Norma L and Pichardo Domingo A
Bought by
Salazar Mario J
Current Estimated Value
Home Financials for this Owner
Home Financials are based on the most recent Mortgage that was taken out on this home.
Original Mortgage
$92,171
Outstanding Balance
$37,987
Interest Rate
6.87%
Mortgage Type
FHA
Estimated Equity
$248,028
Purchase Details
Closed on
Dec 6, 2001
Sold by
Chase Mtg Services Inc
Bought by
Pichardo Domingo A and Campos Norma L
Home Financials for this Owner
Home Financials are based on the most recent Mortgage that was taken out on this home.
Original Mortgage
$40,000
Interest Rate
7.75%
Purchase Details
Closed on
Sep 19, 1997
Sold by
Chase Mtg Services Inc
Bought by
Va
Purchase Details
Closed on
Aug 5, 1997
Sold by
Frappier Robert F
Bought by
Chase Mtg Services Inc
Create a Home Valuation Report for This Property
The Home Valuation Report is an in-depth analysis detailing your home's value as well as a comparison with similar homes in the area
Home Values in the Area
Average Home Value in this Area
Purchase History
| Date | Buyer | Sale Price | Title Company |
|---|---|---|---|
| Salazar Mario J | -- | Texas American Title Company | |
| Pichardo Domingo A | -- | First American Title Co | |
| Va | -- | -- | |
| Chase Mtg Services Inc | $42,798 | -- |
Source: Public Records
Mortgage History
| Date | Status | Borrower | Loan Amount |
|---|---|---|---|
| Open | Salazar Mario J | $92,171 | |
| Previous Owner | Pichardo Domingo A | $40,000 |
Source: Public Records
Tax History Compared to Growth
Tax History
| Year | Tax Paid | Tax Assessment Tax Assessment Total Assessment is a certain percentage of the fair market value that is determined by local assessors to be the total taxable value of land and additions on the property. | Land | Improvement |
|---|---|---|---|---|
| 2025 | $6,417 | $297,757 | $56,000 | $241,757 |
| 2024 | $6,417 | $306,674 | $56,000 | $250,674 |
| 2023 | $6,417 | $279,719 | $56,000 | $223,719 |
| 2022 | $5,549 | $252,023 | $40,000 | $212,023 |
| 2021 | $5,175 | $222,031 | $40,000 | $182,031 |
| 2020 | $4,854 | $200,453 | $40,000 | $160,453 |
| 2019 | $4,125 | $163,000 | $34,000 | $129,000 |
| 2018 | $3,886 | $153,552 | $34,000 | $119,552 |
| 2017 | $3,883 | $153,552 | $34,000 | $119,552 |
| 2016 | $3,731 | $147,555 | $34,000 | $113,555 |
| 2015 | $2,148 | $106,883 | $34,000 | $72,883 |
| 2014 | $2,148 | $83,565 | $22,800 | $60,765 |
Source: Public Records
Map
Nearby Homes
- 8135 Glenbrook Dr
- 8124 Glenbrook Dr
- 8250 Park Place Blvd Unit 303
- 3727 Broadway St
- 8282 Park Place Blvd Unit D1
- 8282 Park Place Blvd Unit G2
- 3743 Erie St
- 0 Dover St Unit 39828065
- 8324 Jennings St
- 7909 Dixie Dr
- 4214 Neal St
- 8158 Easton St
- 7846 Santa Elena St
- 3027 N Bayou Dr
- 8502 Detroit St Unit D
- 8502 Detroit St Unit C
- 8543 Chalcos Dr
- 8145 Easton St
- 8023 Findlay St
- 7937 Grafton St
- 4018 River Dr
- 4006 River Dr
- 8166 Glenbrook Dr
- 8162 Glenbrook Dr
- 8159 Niles St
- 4024 River Dr
- 4005 River Dr
- 4011 River Dr
- 8158 Glenbrook Dr
- 11651 Glennbrook Garden R
- 9957 Glen Brook Ln
- 4019 River Dr
- 8157 Niles St
- 8150 Glenbrook Dr
- 4103 River Dr
- 8155 Niles St
- 8167 Glenbrook Dr
- 8163 Glenbrook Dr
- 4001 River Dr
- 8148 Glenbrook Dr