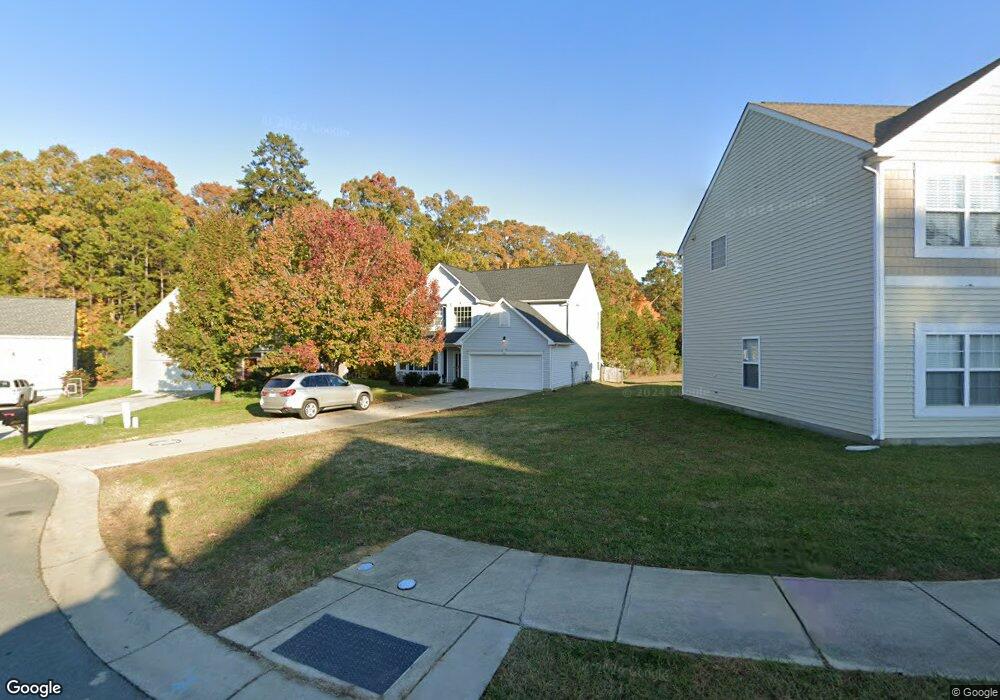
4010 Saphire Ln Indian Trail, NC 28079
Estimated Value: $387,000 - $424,255
5
Beds
3
Baths
2,144
Sq Ft
$189/Sq Ft
Est. Value
About This Home
This home is located at 4010 Saphire Ln, Indian Trail, NC 28079 and is currently estimated at $404,564, approximately $188 per square foot. 4010 Saphire Ln is a home located in Union County with nearby schools including Hemby Bridge Elementary School, Porter Ridge Middle School, and Porter Ridge High School.
Ownership History
Date
Name
Owned For
Owner Type
Purchase Details
Closed on
Jul 26, 2017
Sold by
Freo North Carolina Llc
Bought by
Progress Residential Borrower 1 Llc
Current Estimated Value
Home Financials for this Owner
Home Financials are based on the most recent Mortgage that was taken out on this home.
Original Mortgage
$458,612
Outstanding Balance
$382,159
Interest Rate
3.91%
Mortgage Type
Future Advance Clause Open End Mortgage
Estimated Equity
$22,405
Purchase Details
Closed on
Jul 28, 2016
Sold by
Griiffin Tracey
Bought by
Freo North Carolina Llc
Purchase Details
Closed on
Jul 19, 2005
Sold by
Griffin Tracey
Bought by
Griffin Tracey and Taylor Vivian
Purchase Details
Closed on
Sep 24, 2004
Sold by
Eastwood Construction Co Inc
Bought by
Griffin Tracey
Home Financials for this Owner
Home Financials are based on the most recent Mortgage that was taken out on this home.
Original Mortgage
$133,897
Interest Rate
7.99%
Mortgage Type
Unknown
Create a Home Valuation Report for This Property
The Home Valuation Report is an in-depth analysis detailing your home's value as well as a comparison with similar homes in the area
Home Values in the Area
Average Home Value in this Area
Purchase History
| Date | Buyer | Sale Price | Title Company |
|---|---|---|---|
| Progress Residential Borrower 1 Llc | -- | None Available | |
| Freo North Carolina Llc | $176,000 | None Available | |
| Griffin Tracey | -- | Secured Title Llc | |
| Griffin Tracey | $179,000 | -- |
Source: Public Records
Mortgage History
| Date | Status | Borrower | Loan Amount |
|---|---|---|---|
| Open | Progress Residential Borrower 1 Llc | $458,612 | |
| Previous Owner | Griffin Tracey | $133,897 |
Source: Public Records
Tax History Compared to Growth
Tax History
| Year | Tax Paid | Tax Assessment Tax Assessment Total Assessment is a certain percentage of the fair market value that is determined by local assessors to be the total taxable value of land and additions on the property. | Land | Improvement |
|---|---|---|---|---|
| 2024 | $2,298 | $272,400 | $52,000 | $220,400 |
| 2023 | $2,279 | $272,400 | $52,000 | $220,400 |
| 2022 | $2,279 | $272,400 | $52,000 | $220,400 |
| 2021 | $2,279 | $272,400 | $52,000 | $220,400 |
| 2020 | $1,397 | $179,200 | $31,500 | $147,700 |
| 2019 | $1,782 | $179,200 | $31,500 | $147,700 |
| 2018 | $1,397 | $179,200 | $31,500 | $147,700 |
| 2017 | $1,874 | $179,200 | $31,500 | $147,700 |
| 2016 | $1,460 | $179,200 | $31,500 | $147,700 |
| 2015 | $1,483 | $179,200 | $31,500 | $147,700 |
| 2014 | $1,396 | $195,490 | $43,500 | $151,990 |
Source: Public Records
Map
Nearby Homes
- 2003 Red Carpet Ct
- 4004 Chimney Wood Trail
- 3114 Less Traveled Trail
- 4012 Crismark Dr
- 5002 Fine Robe Dr
- 8012 Red Lantern Rd
- 1009 Atherton Dr
- 4006 Tremont Dr
- 6313 Mill Grove Rd
- 8207 Beacon Hills Rd
- 8005 Beacon Hills Rd
- 2001 Thurston Dr
- 5516 Gold Crest Dr
- 2501 Ivy Run Dr
- 7902 Hemby Wood Dr
- 2332 Ivy Run Dr
- 6101 Clearwater Dr
- 8203 Wynnview Rd
- 5014 Scaleybark Ct
- 5020 Scaleybark Ct
- 4012 Saphire Ln
- 1005 Tiger Eye Ave
- 1003 Tiger Eye Ave
- 1007 Tiger Eye Ave
- 4014 Saphire Ln
- 1001 Tiger Eye Ave
- 1009 Tiger Eye Ave
- 4016 Saphire Ln
- 4007 Saphire Ln
- 4005 Saphire Ln
- 4015 Saphire Ln
- 4009 Saphire Ln
- 1011 Tiger Eye Ave
- 4003 Saphire Ln
- 3016 Saphire Ln
- 1006 Tiger Eye Ave
- 4013 Saphire Ln
- 4001 Saphire Ln
- 4011 Saphire Ln
- 1013 Tiger Eye Ave