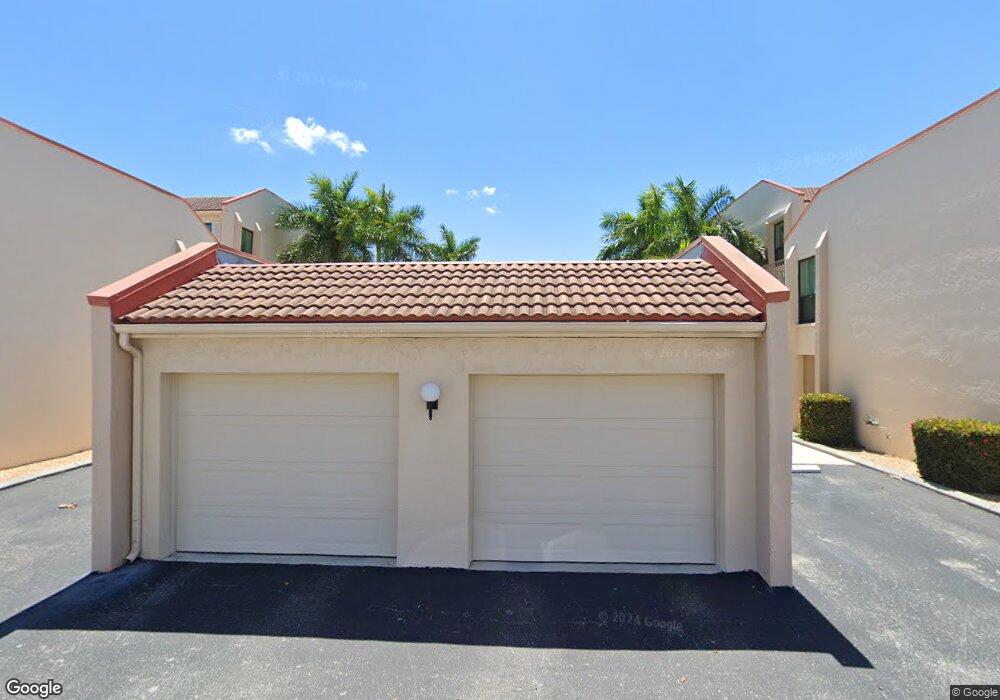
4010 SE 20th Place Unit 3 Cape Coral, FL 33904
Estimated Value: $299,035 - $402,000
2
Beds
2
Baths
1,296
Sq Ft
$254/Sq Ft
Est. Value
About This Home
This home is located at 4010 SE 20th Place Unit 3, Cape Coral, FL 33904 and is currently estimated at $328,759, approximately $253 per square foot. 4010 SE 20th Place Unit 3 is a home located in Lee County with nearby schools including Cape Elementary School, Caloosa Elementary School, and Tropic Isles Elementary School.
Ownership History
Date
Name
Owned For
Owner Type
Purchase Details
Closed on
Jul 22, 2020
Sold by
Sandera Mitzi Martin
Bought by
Milby Christopher L and Milby Deane L
Current Estimated Value
Home Financials for this Owner
Home Financials are based on the most recent Mortgage that was taken out on this home.
Original Mortgage
$200,000
Outstanding Balance
$177,676
Interest Rate
3.2%
Mortgage Type
New Conventional
Estimated Equity
$151,083
Purchase Details
Closed on
Oct 18, 2017
Sold by
Giese Ann
Bought by
Sanders Mitzi Martin
Home Financials for this Owner
Home Financials are based on the most recent Mortgage that was taken out on this home.
Original Mortgage
$218,500
Interest Rate
3.78%
Mortgage Type
New Conventional
Purchase Details
Closed on
Jun 1, 2012
Sold by
Giese Ellsworth A
Bought by
Giese Ellsworth A and Giese Ann
Create a Home Valuation Report for This Property
The Home Valuation Report is an in-depth analysis detailing your home's value as well as a comparison with similar homes in the area
Home Values in the Area
Average Home Value in this Area
Purchase History
| Date | Buyer | Sale Price | Title Company |
|---|---|---|---|
| Milby Christopher L | $250,000 | Townsend Title Ins Agcy Llc | |
| Sanders Mitzi Martin | $230,000 | Realty Title Siolutions Llp | |
| Giese Ellsworth A | -- | None Available |
Source: Public Records
Mortgage History
| Date | Status | Borrower | Loan Amount |
|---|---|---|---|
| Open | Milby Christopher L | $200,000 | |
| Previous Owner | Sanders Mitzi Martin | $218,500 |
Source: Public Records
Tax History Compared to Growth
Tax History
| Year | Tax Paid | Tax Assessment Tax Assessment Total Assessment is a certain percentage of the fair market value that is determined by local assessors to be the total taxable value of land and additions on the property. | Land | Improvement |
|---|---|---|---|---|
| 2025 | $5,221 | $265,587 | -- | $265,587 |
| 2024 | $5,760 | $302,183 | -- | $302,183 |
| 2023 | $5,760 | $372,250 | $0 | $373,939 |
| 2022 | $3,899 | $204,555 | $0 | $0 |
| 2021 | $3,540 | $185,959 | $0 | $185,959 |
| 2020 | $2,621 | $169,575 | $0 | $169,575 |
| 2019 | $2,629 | $170,383 | $0 | $170,383 |
| 2018 | $3,141 | $194,608 | $0 | $194,608 |
| 2017 | $1,380 | $100,210 | $0 | $0 |
| 2016 | $1,365 | $195,756 | $0 | $195,756 |
| 2015 | $1,356 | $169,100 | $0 | $169,100 |
| 2014 | -- | $140,500 | $0 | $140,500 |
| 2013 | -- | $145,800 | $0 | $145,800 |
Source: Public Records
Map
Nearby Homes
- 4002 SE 20th Place Unit 4
- 4001 SE 19th Place Unit 1
- 4013 SE 19th Place Unit 101
- 4013 SE 20th Place Unit 401
- 4013 SE 20th Place Unit 505
- 1929 SE 40th Terrace Unit 2
- 4015 SE 20th Place Unit 206
- 4015 SE 20th Place Unit 301
- 4015 SE 20th Place Unit 503
- 4015 SE 19th Ave Unit 5-9
- 4103 SE 19th Ave Unit 206
- 1911 SE 40th Terrace Unit 201
- 4109 SE 19th Ave Unit 207
- 4116 SE 19th Ave Unit 102
- 1949 Beach Pkwy Unit 216
- 1907 SE 40th Terrace Unit 102
- 4113 SE 19th Ave Unit A-B
- 4012 SE 19th Ave Unit 103
- 4104 SE 19th Ave Unit 202
- 4117 SE 19th Ave
- 4010 SE 20th Place Unit C3
- 4010 SE 20th Place Unit 7
- 4010 SE 20th Place Unit 7
- 4010 SE 20th Place Unit 5
- 4010 SE 20th Place Unit 4
- 4010 SE 20th Place Unit 8
- 4010 SE 20th Place Unit 6
- 4010 SE 20th Place Unit 2
- 4010 SE 20th Place Unit 1
- 4012 SE 20th Place Unit 2
- 4012 SE 20th Place Unit 1
- 4000 SE 20th Place Unit G1
- 4000 SE 20th Place Unit 1
- 4000 SE 20th Place Unit 3
- 4000 SE 20th Place Unit 2
- 4000 SE 20th Place Unit G2
- 4006 SE 20th Place Unit A5
- 4006 SE 20th Place Unit A4
- 4006 SE 20th Place Unit 1
- 4006 SE 20th Place Unit 7