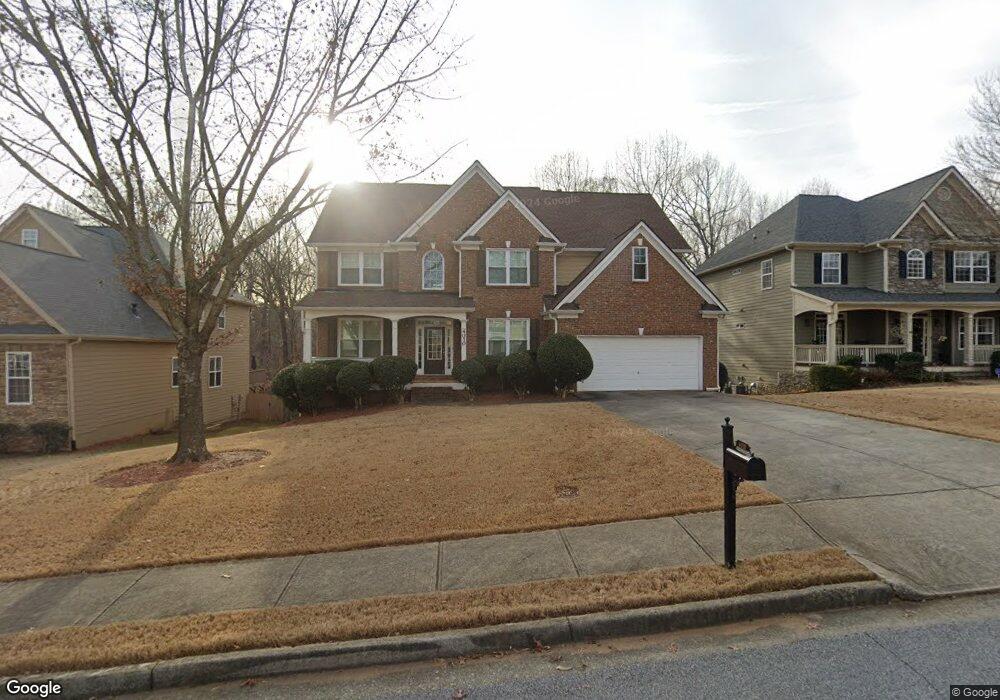
4010 Suwanee Bend Dr Suwanee, GA 30024
Estimated Value: $572,204 - $659,000
5
Beds
3
Baths
2,578
Sq Ft
$236/Sq Ft
Est. Value
About This Home
This home is located at 4010 Suwanee Bend Dr, Suwanee, GA 30024 and is currently estimated at $607,551, approximately $235 per square foot. 4010 Suwanee Bend Dr is a home located in Gwinnett County with nearby schools including Roberts Elementary School, North Gwinnett Middle School, and North Gwinnett High School.
Ownership History
Date
Name
Owned For
Owner Type
Purchase Details
Closed on
Jul 6, 2017
Sold by
Yi Katherine K
Bought by
Hong Jin Ki and Hong In Hye
Current Estimated Value
Home Financials for this Owner
Home Financials are based on the most recent Mortgage that was taken out on this home.
Original Mortgage
$353,285
Outstanding Balance
$292,092
Interest Rate
3.89%
Mortgage Type
VA
Estimated Equity
$315,459
Purchase Details
Closed on
Nov 1, 2010
Sold by
Yi Katherine K
Bought by
Yi Katherine K
Home Financials for this Owner
Home Financials are based on the most recent Mortgage that was taken out on this home.
Original Mortgage
$158,500
Interest Rate
4.18%
Mortgage Type
New Conventional
Purchase Details
Closed on
Mar 28, 2003
Sold by
Ccd Homes Llc
Bought by
Kim Katherine
Home Financials for this Owner
Home Financials are based on the most recent Mortgage that was taken out on this home.
Original Mortgage
$198,400
Interest Rate
5.79%
Mortgage Type
New Conventional
Create a Home Valuation Report for This Property
The Home Valuation Report is an in-depth analysis detailing your home's value as well as a comparison with similar homes in the area
Home Values in the Area
Average Home Value in this Area
Purchase History
| Date | Buyer | Sale Price | Title Company |
|---|---|---|---|
| Hong Jin Ki | $342,000 | -- | |
| Yi Katherine K | -- | -- | |
| Kim Katherine | $248,000 | -- |
Source: Public Records
Mortgage History
| Date | Status | Borrower | Loan Amount |
|---|---|---|---|
| Open | Hong Jin Ki | $353,285 | |
| Previous Owner | Yi Katherine K | $158,500 | |
| Previous Owner | Kim Katherine | $30,000 | |
| Previous Owner | Kim Katherine | $198,400 |
Source: Public Records
Tax History Compared to Growth
Tax History
| Year | Tax Paid | Tax Assessment Tax Assessment Total Assessment is a certain percentage of the fair market value that is determined by local assessors to be the total taxable value of land and additions on the property. | Land | Improvement |
|---|---|---|---|---|
| 2025 | $6,770 | $235,280 | $38,000 | $197,280 |
| 2024 | $6,340 | $206,600 | $42,000 | $164,600 |
| 2023 | $6,340 | $206,600 | $42,000 | $164,600 |
| 2022 | $6,085 | $195,760 | $42,000 | $153,760 |
| 2021 | $5,163 | $147,320 | $35,600 | $111,720 |
| 2020 | $5,103 | $142,960 | $30,000 | $112,960 |
| 2019 | $4,930 | $142,960 | $30,000 | $112,960 |
| 2018 | $4,640 | $129,160 | $30,000 | $99,160 |
| 2016 | $4,002 | $117,120 | $26,000 | $91,120 |
| 2015 | $3,760 | $104,280 | $24,800 | $79,480 |
| 2014 | $3,468 | $93,600 | $20,400 | $73,200 |
Source: Public Records
Map
Nearby Homes
- 3998 Oak Crossing Dr NE
- 3941 Oak Crossing Dr
- 3720 Crescent Walk Ln
- 3740 Crescent Walk Ln
- 358 Rhodes House Ct
- 3720 Brookefall Landing
- 4450 Woodward Walk Ln
- 4071 Woodward Walk Ln
- 3612 Brookefall Ct
- 407 Vista Lake Dr
- 3713 Lake Edge Dr
- 4154 Hawking Dr
- 4614 Austin Hills Dr
- 4217 Heisenberg Ln
- 4310 Woodward Walk Ln
- 4394 Austin Hills Dr Unit 1
- 665 Roxford Ln Unit 3
- 4045 Hillcrest View Ct
- 4020 Suwanee Bend Dr
- 4000 Suwanee Bend Dr
- 4030 Suwanee Bend Dr
- 3990 Suwanee Bend Dr
- 3775 Old Suwanee Rd
- 4040 Suwanee Bend Dr
- 4015 Suwanee Bend Dr
- 4005 Suwanee Bend Dr
- 3980 Suwanee Bend Dr
- 4025 Suwanee Bend Dr
- 3785 Old Suwanee Rd Unit 5
- 3995 Suwanee Bend Dr
- 4035 Suwanee Bend Dr
- 4050 Suwanee Bend Dr
- 3765 Old Suwanee Rd
- 3970 Suwanee Bend Dr
- 3985 Suwanee Bend Dr
- 4045 Suwanee Bend Dr
- 3755 Old Suwanee Rd
- 4060 Suwanee Bend Dr