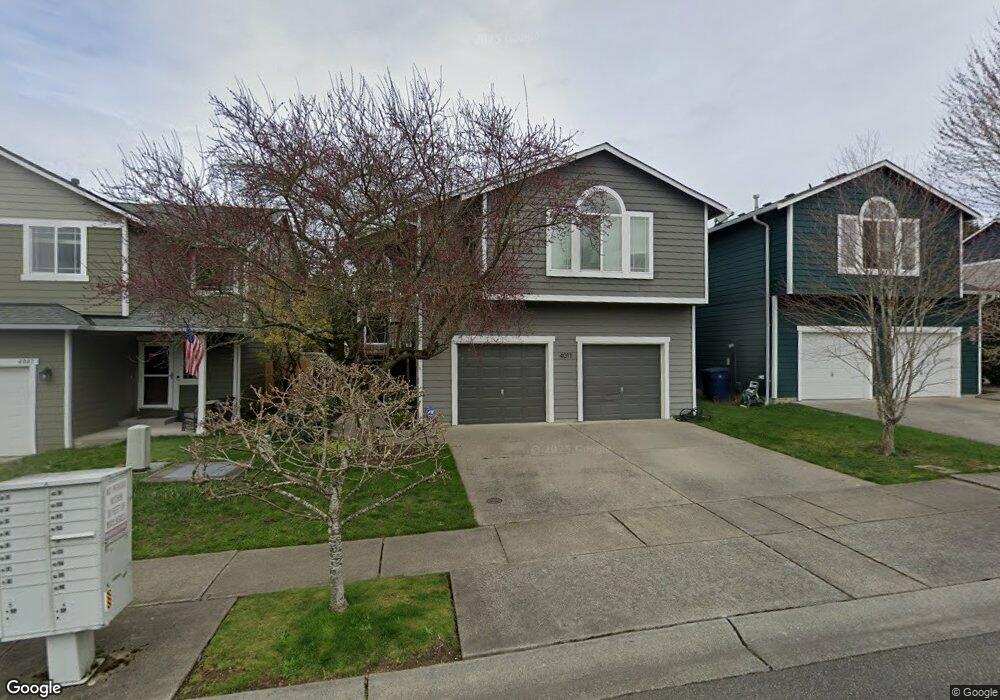
4011 152nd Place SE Unit 10 Bothell, WA 98012
Estimated Value: $724,000 - $825,577
5
Beds
3
Baths
1,998
Sq Ft
$390/Sq Ft
Est. Value
About This Home
This home is located at 4011 152nd Place SE Unit 10, Bothell, WA 98012 and is currently estimated at $778,644, approximately $389 per square foot. 4011 152nd Place SE Unit 10 is a home located in Snohomish County with nearby schools including Forest View Elementary School, Gateway Middle School, and Henry M. Jackson High School.
Ownership History
Date
Name
Owned For
Owner Type
Purchase Details
Closed on
Sep 17, 2010
Sold by
Us Bank National Association
Bought by
Hindman Debra J
Current Estimated Value
Home Financials for this Owner
Home Financials are based on the most recent Mortgage that was taken out on this home.
Original Mortgage
$202,000
Outstanding Balance
$132,980
Interest Rate
4.38%
Mortgage Type
New Conventional
Estimated Equity
$645,664
Purchase Details
Closed on
Jul 9, 2010
Sold by
Alfather Eldina and Alfather Robert
Bought by
U S Bank National Association
Purchase Details
Closed on
Dec 3, 2004
Sold by
Presidio Llc
Bought by
Alfather Robert and Alfather Eldina
Home Financials for this Owner
Home Financials are based on the most recent Mortgage that was taken out on this home.
Original Mortgage
$234,400
Interest Rate
5.75%
Mortgage Type
Unknown
Create a Home Valuation Report for This Property
The Home Valuation Report is an in-depth analysis detailing your home's value as well as a comparison with similar homes in the area
Home Values in the Area
Average Home Value in this Area
Purchase History
| Date | Buyer | Sale Price | Title Company |
|---|---|---|---|
| Hindman Debra J | $252,500 | First American | |
| U S Bank National Association | $208,000 | 1St Am | |
| Alfather Robert | $293,000 | Chicago Title |
Source: Public Records
Mortgage History
| Date | Status | Borrower | Loan Amount |
|---|---|---|---|
| Open | Hindman Debra J | $202,000 | |
| Previous Owner | Alfather Robert | $234,400 | |
| Closed | Alfather Robert | $58,600 |
Source: Public Records
Tax History Compared to Growth
Tax History
| Year | Tax Paid | Tax Assessment Tax Assessment Total Assessment is a certain percentage of the fair market value that is determined by local assessors to be the total taxable value of land and additions on the property. | Land | Improvement |
|---|---|---|---|---|
| 2025 | $6,680 | $709,800 | $425,000 | $284,800 |
| 2024 | $6,680 | $707,200 | $432,000 | $275,200 |
| 2023 | $6,774 | $786,700 | $470,000 | $316,700 |
| 2022 | $5,510 | $553,100 | $285,000 | $268,100 |
| 2020 | $5,709 | $481,600 | $250,000 | $231,600 |
| 2019 | $5,009 | $423,400 | $200,000 | $223,400 |
| 2018 | $4,805 | $369,900 | $170,000 | $199,900 |
| 2017 | $4,280 | $332,100 | $115,000 | $217,100 |
| 2016 | $3,978 | $318,200 | $110,000 | $208,200 |
| 2015 | $3,550 | $268,300 | $99,000 | $169,300 |
| 2013 | $3,026 | $201,700 | $81,000 | $120,700 |
Source: Public Records
Map
Nearby Homes
- 14915 38th Dr SE Unit JJ1180
- 14915 38th Dr SE Unit S1148
- 14915 38th Dr SE Unit S1146
- 14915 38th Dr SE Unit 2049
- 4012 147th Place SE
- 3504 Seattle Hill Rd Unit 30
- 4620 151st Place SE
- 14632 35th Dr SE
- 4620 145th Place SE
- 14220 41st Dr SE
- 16119 35th Dr SE
- 15901 30th Dr SE
- 14117 45th Ave SE
- 16008 30th Dr SE
- 15000 Village Green Dr Unit 19
- 16519 37th Dr SE
- 14322 51st Ave SE
- 14522 54th Ave SE
- 5411 147th St SE
- 16606 35th Ave SE Unit 9A
- 4013 152nd Place SE Unit 9
- 4007 152nd Place SE Unit 11
- 4015 152nd Place SE Unit 8
- 4003 152nd Place SE Unit 12
- 4017 152nd Place SE Unit 7
- 4027 152nd Place SE Unit 2
- 3931 152nd Place SE Unit 14
- 3933 152nd Place SE
- 4008 152nd Place SE Unit 38
- 4012 152nd Place SE
- 4025 152nd Place SE Unit 3
- 4019 152nd Place SE Unit 6
- 4006 152nd Place SE Unit 37
- 4029 152nd Place SE Unit 1
- 4020 152nd Place SE
- 4023 152nd Place SE Unit 4
- 4004 152nd Place SE Unit 36
- 4030 152nd Place SE Unit 41
- 3927 152nd Place SE Unit 16
- 4021 152nd Place SE Unit 5