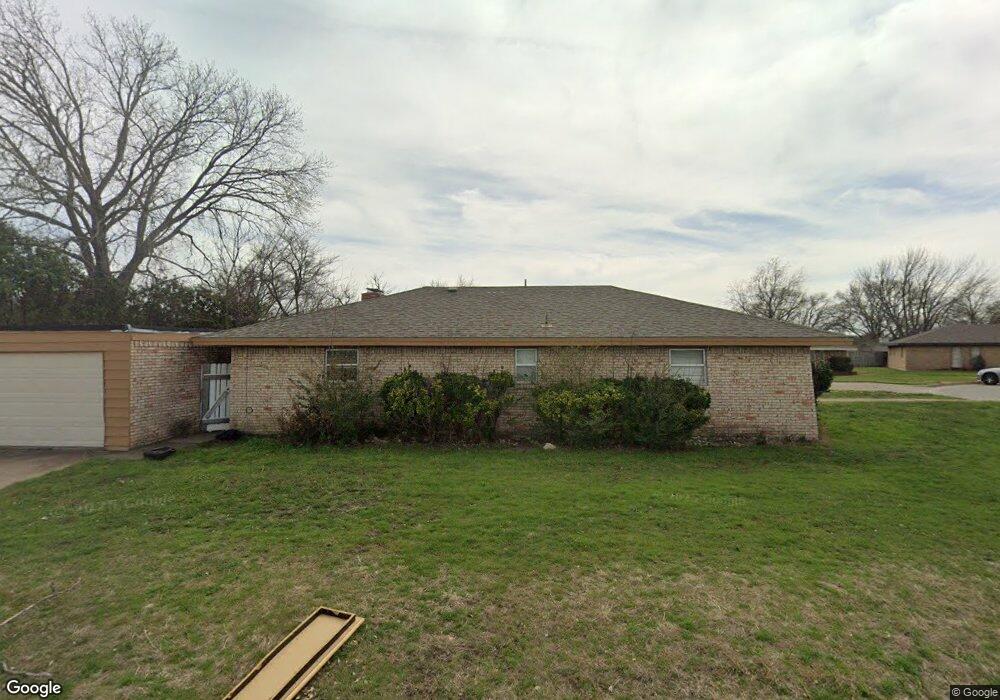
4011 Altamesa Blvd Fort Worth, TX 76133
Wedgwood NeighborhoodEstimated Value: $351,356 - $400,000
6
Beds
4
Baths
2,808
Sq Ft
$134/Sq Ft
Est. Value
About This Home
This home is located at 4011 Altamesa Blvd, Fort Worth, TX 76133 and is currently estimated at $376,589, approximately $134 per square foot. 4011 Altamesa Blvd is a home located in Tarrant County with nearby schools including Woodway Elementary School, Wedgwood Middle School, and Wedgwood Sixth Grade Center.
Ownership History
Date
Name
Owned For
Owner Type
Purchase Details
Closed on
Feb 28, 2022
Sold by
Wayne Jones James
Bought by
Mehta Alpa
Current Estimated Value
Home Financials for this Owner
Home Financials are based on the most recent Mortgage that was taken out on this home.
Original Mortgage
$300,000
Interest Rate
3.55%
Mortgage Type
Construction
Purchase Details
Closed on
Jan 26, 2004
Sold by
Jones James Wayne and Kennemer Rebecca J
Bought by
Jones James Wayne
Home Financials for this Owner
Home Financials are based on the most recent Mortgage that was taken out on this home.
Original Mortgage
$62,000
Interest Rate
5.79%
Mortgage Type
Stand Alone Refi Refinance Of Original Loan
Purchase Details
Closed on
Apr 18, 1994
Sold by
Johnson Peggy M and Johnson Karen Elaine
Bought by
Jones James Wayne and Kennemer Rebecca J
Create a Home Valuation Report for This Property
The Home Valuation Report is an in-depth analysis detailing your home's value as well as a comparison with similar homes in the area
Home Values in the Area
Average Home Value in this Area
Purchase History
| Date | Buyer | Sale Price | Title Company |
|---|---|---|---|
| Mehta Alpa | -- | Independence Title Company | |
| Mehta Alpa | $399,000 | Independence Title Company | |
| Jones James Wayne | -- | Landamerica | |
| Jones James Wayne | -- | Rattikin Title Company |
Source: Public Records
Mortgage History
| Date | Status | Borrower | Loan Amount |
|---|---|---|---|
| Closed | Mehta Alpa | $300,000 | |
| Previous Owner | Jones James Wayne | $62,000 |
Source: Public Records
Tax History Compared to Growth
Tax History
| Year | Tax Paid | Tax Assessment Tax Assessment Total Assessment is a certain percentage of the fair market value that is determined by local assessors to be the total taxable value of land and additions on the property. | Land | Improvement |
|---|---|---|---|---|
| 2025 | $6,704 | $298,768 | $45,000 | $253,768 |
| 2024 | $6,704 | $298,768 | $45,000 | $253,768 |
| 2023 | $6,289 | $277,948 | $45,000 | $232,948 |
| 2022 | $6,830 | $262,732 | $40,000 | $222,732 |
| 2021 | $4,903 | $178,744 | $40,000 | $138,744 |
| 2020 | $4,835 | $182,674 | $40,000 | $142,674 |
| 2019 | $5,061 | $183,958 | $40,000 | $143,958 |
| 2018 | $3,880 | $141,050 | $16,000 | $125,050 |
| 2017 | $4,612 | $162,811 | $16,000 | $146,811 |
| 2016 | $3,370 | $118,956 | $16,000 | $102,956 |
| 2015 | $3,009 | $106,000 | $16,500 | $89,500 |
| 2014 | $3,009 | $106,000 | $16,500 | $89,500 |
Source: Public Records
Map
Nearby Homes
- 4032 Aragon Dr
- 4021 Aragon Dr
- 6404 San Juan Ave
- 6709 Santiago Ave
- 3925 Wedgworth Rd S
- 4021 Toledo Ave
- 4255 Cadiz Dr
- 3836 Wedgworth Rd S
- 6809 Welch Ave
- 6800 Welch Ave
- 3809 Misty Meadow Dr
- 6033 Worrell Dr
- 3800 Wedgworth Rd S
- 6021 Wester Ave
- 3817 Misty Meadow Dr
- 3753 Misty Meadow Dr
- 4225 Capilla St
- 3901 Willow Way Rd
- 6758 Cartagena Ct
- 4313 Barcelona Dr
- 4009 Altamesa Blvd
- 4011 Altamesa Blvd Unit 4009
- 6400 Ponce Ave
- 4013 Altamesa Blvd
- 6404 Ponce Ave
- 6408 Ponce Ave
- 4021 Altamesa Blvd
- 4017 Altamesa Blvd
- 6416 Ponce Ave
- 6403 Ponce Ave
- 4044 Alicante Ave
- 6401 Ponce Ave
- 6405 Ponce Ave
- 4103 Altamesa Blvd
- 4101 Altamesa Blvd
- 6409 Ponce Ave
- 6420 Ponce Ave
- 4048 Alicante Ave
- 4105 Altamesa Blvd
- 6413 Ponce Ave