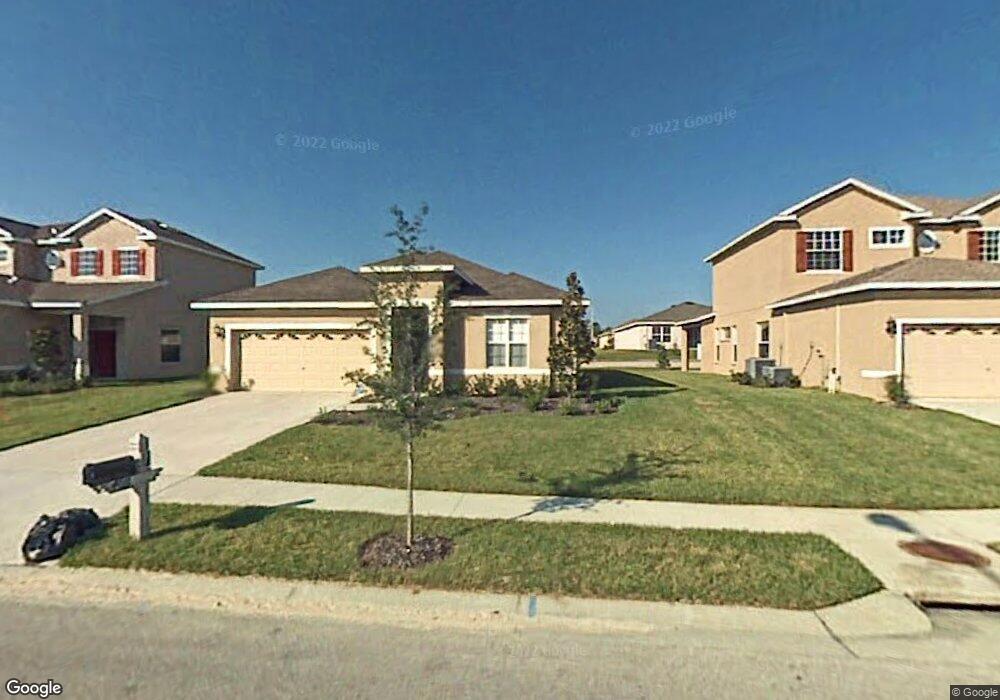
4011 Beaumont Loop Spring Hill, FL 34609
Estimated Value: $293,597 - $323,000
4
Beds
2
Baths
1,873
Sq Ft
$166/Sq Ft
Est. Value
About This Home
This home is located at 4011 Beaumont Loop, Spring Hill, FL 34609 and is currently estimated at $311,649, approximately $166 per square foot. 4011 Beaumont Loop is a home located in Hernando County with nearby schools including Pine Grove Elementary School, West Hernando Middle School, and Central High School.
Ownership History
Date
Name
Owned For
Owner Type
Purchase Details
Closed on
Oct 23, 2025
Sold by
Mansour Mitch Tareq and Mansour Lindsay Rose
Bought by
Mansour Lindsay Rose
Current Estimated Value
Purchase Details
Closed on
Feb 16, 2012
Sold by
Cicarelli John
Bought by
Mansour Lindsay and Mansour Mitch
Purchase Details
Closed on
May 12, 2011
Sold by
Federal Home Loan Mortgage Corporation
Bought by
Cicarelli John
Purchase Details
Closed on
Oct 20, 2010
Sold by
Perez Diosvany and Herrera Yenis
Bought by
Wells Fargo Bank N A
Purchase Details
Closed on
Oct 18, 2010
Sold by
Wells Fargo Bank N A
Bought by
Federal Home Loan Mortgage Corp
Purchase Details
Closed on
Aug 24, 2007
Sold by
Avatar Properties Inc
Bought by
Perez Diosvany and Herrera Yenis
Home Financials for this Owner
Home Financials are based on the most recent Mortgage that was taken out on this home.
Original Mortgage
$167,162
Interest Rate
6.7%
Mortgage Type
Purchase Money Mortgage
Create a Home Valuation Report for This Property
The Home Valuation Report is an in-depth analysis detailing your home's value as well as a comparison with similar homes in the area
Home Values in the Area
Average Home Value in this Area
Purchase History
| Date | Buyer | Sale Price | Title Company |
|---|---|---|---|
| Mansour Lindsay Rose | $100 | None Listed On Document | |
| Mansour Lindsay | $103,400 | Total Title Solutions Clw | |
| Cicarelli John | $55,500 | New House Title | |
| Wells Fargo Bank N A | -- | Attorney | |
| Federal Home Loan Mortgage Corp | -- | New House Title | |
| Perez Diosvany | $176,000 | Prominent Title Insurance Ag |
Source: Public Records
Mortgage History
| Date | Status | Borrower | Loan Amount |
|---|---|---|---|
| Previous Owner | Perez Diosvany | $167,162 |
Source: Public Records
Tax History
| Year | Tax Paid | Tax Assessment Tax Assessment Total Assessment is a certain percentage of the fair market value that is determined by local assessors to be the total taxable value of land and additions on the property. | Land | Improvement |
|---|---|---|---|---|
| 2025 | $5,852 | $212,669 | -- | -- |
| 2024 | $5,689 | $193,335 | -- | -- |
| 2023 | $5,689 | $175,759 | $0 | $0 |
| 2022 | $5,321 | $159,781 | $0 | $0 |
| 2021 | $2,394 | $146,692 | $13,943 | $132,749 |
| 2020 | $4,385 | $135,225 | $13,943 | $121,282 |
| 2019 | $4,305 | $128,662 | $13,943 | $114,719 |
| 2018 | $1,725 | $116,657 | $13,585 | $103,072 |
| 2017 | $3,623 | $102,902 | $13,585 | $89,317 |
| 2016 | $3,493 | $90,192 | $0 | $0 |
| 2015 | $3,364 | $81,993 | $0 | $0 |
| 2014 | $3,019 | $74,539 | $0 | $0 |
Source: Public Records
Map
Nearby Homes
- 3483 Beaumont Loop
- 4330 Crosswhite Ct
- 12943 Impatiens St
- 13628 Covey Run Place
- 4344 High Ridge Ave
- 4460 Birchfield Loop
- 13116 Haverhill Dr
- 4724 Birchfield Loop
- 4233 Bramblewood Loop
- 13323 Bainbridge Way
- 12402 Langley Dr Unit Lot 77
- 12422 Langley Dr Unit Lot 79
- 3780 Obsidian Dr
- 3768 Obsidian Dr
- 3734 Obsidian Dr
- 3737 Obsidian Dr
- 4771 Sand Ridge Blvd
- 4696 Sutherland St Unit Lot 126
- 4156 Feldspar Ln
- 3709 Obsidian Dr
- 3983 Beaumont Loop
- 4033 Beaumont Loop
- 3961 Beaumont Loop
- 3687 Beaumont Loop
- 3709 Beaumont Loop
- 3663 Beaumont Loop
- 4053 Beaumont Loop
- 3937 Beaumont Loop
- 3731 Beaumont Loop
- 3641 Beaumont Loop
- 4079 Beaumont Loop
- 3984 Beaumont Loop
- 4034 Beaumont Loop
- 3962 Beaumont Loop
- 3755 Beaumont Loop
- 3617 Beaumont Loop
- 4054 Beaumont Loop
- 4099 Beaumont Loop
- 3938 Beaumont Loop
- 13147 Mandalay Place
Your Personal Tour Guide
Ask me questions while you tour the home.