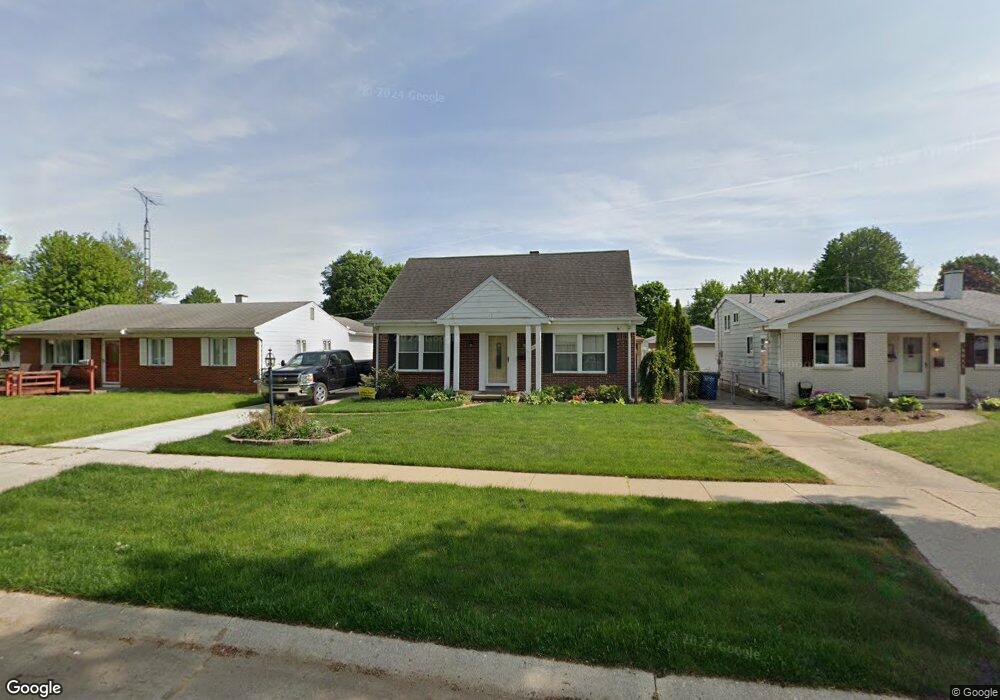
4011 Clover Ridge Ct Toledo, OH 43623
Franklin Park NeighborhoodEstimated Value: $184,000 - $223,000
3
Beds
2
Baths
1,652
Sq Ft
$123/Sq Ft
Est. Value
About This Home
This home is located at 4011 Clover Ridge Ct, Toledo, OH 43623 and is currently estimated at $202,702, approximately $122 per square foot. 4011 Clover Ridge Ct is a home located in Lucas County with nearby schools including Monac Elementary School, Washington Junior High School, and Jefferson Junior High School.
Ownership History
Date
Name
Owned For
Owner Type
Purchase Details
Closed on
Aug 29, 2006
Sold by
Leonhardt Sherrie
Bought by
Nevins James N
Current Estimated Value
Home Financials for this Owner
Home Financials are based on the most recent Mortgage that was taken out on this home.
Original Mortgage
$145,500
Outstanding Balance
$88,374
Interest Rate
6.88%
Mortgage Type
Purchase Money Mortgage
Estimated Equity
$114,328
Purchase Details
Closed on
Jun 28, 2004
Sold by
Miller Daniel J and Suan Michele J
Bought by
Leonhardt Sherrie
Home Financials for this Owner
Home Financials are based on the most recent Mortgage that was taken out on this home.
Original Mortgage
$114,000
Interest Rate
6.39%
Mortgage Type
Purchase Money Mortgage
Purchase Details
Closed on
May 20, 1998
Sold by
Miller Norbert J Sr Tr and Miller Vivian A
Bought by
Miller Norbert J
Create a Home Valuation Report for This Property
The Home Valuation Report is an in-depth analysis detailing your home's value as well as a comparison with similar homes in the area
Home Values in the Area
Average Home Value in this Area
Purchase History
| Date | Buyer | Sale Price | Title Company |
|---|---|---|---|
| Nevins James N | $145,500 | Chicago Title Insurance Co | |
| Leonhardt Sherrie | $127,000 | -- | |
| Miller Norbert J | -- | -- |
Source: Public Records
Mortgage History
| Date | Status | Borrower | Loan Amount |
|---|---|---|---|
| Open | Nevins James N | $145,500 | |
| Previous Owner | Leonhardt Sherrie | $114,000 |
Source: Public Records
Tax History Compared to Growth
Tax History
| Year | Tax Paid | Tax Assessment Tax Assessment Total Assessment is a certain percentage of the fair market value that is determined by local assessors to be the total taxable value of land and additions on the property. | Land | Improvement |
|---|---|---|---|---|
| 2024 | $1,691 | $56,035 | $5,950 | $50,085 |
| 2023 | $3,193 | $45,185 | $5,005 | $40,180 |
| 2022 | $3,182 | $45,185 | $5,005 | $40,180 |
| 2021 | $3,248 | $45,185 | $5,005 | $40,180 |
| 2020 | $3,132 | $37,590 | $4,165 | $33,425 |
| 2019 | $3,049 | $37,590 | $4,165 | $33,425 |
| 2018 | $2,608 | $37,590 | $4,165 | $33,425 |
| 2017 | $2,451 | $30,765 | $4,795 | $25,970 |
| 2016 | $2,443 | $87,900 | $13,700 | $74,200 |
| 2015 | $2,434 | $87,900 | $13,700 | $74,200 |
| 2014 | $2,053 | $30,140 | $4,800 | $25,340 |
| 2013 | $2,053 | $30,140 | $4,800 | $25,340 |
Source: Public Records
Map
Nearby Homes
- 5838 Vail Ave
- 5762 Steffens Ave
- 5754 Harvest Ln
- 5768 Home Ln
- 5822 Friedly Dr
- 5563 Harschel Dr
- 5565 Steffens Ave
- 5848 Acoma Dr
- 3456 W Alexis Rd
- 5949 Murnen Rd
- 5523 Fenwick Dr
- 5623 Mantey Ln
- 5447 Harvest Ln
- 6399 Whiteford Center Rd
- 5404 Harschel Dr
- 5415 Fenwick Dr
- 6220 Whiteford Center Rd
- 6240 Whiteford Center Rd
- 5539 Ginger Tree Ln
- 3334 Thelma Dr
- 4015 Clover Ridge Ct
- 4005 Clover Ridge Ct
- 4021 Clover Ridge Ct
- 4012 Stock Ave
- 4014 Stock Ave
- 4006 Stock Ave
- 4025 Clover Ridge Ct
- 4020 Stock Ave
- 4012 Clover Ridge Ct
- 4018 Clover Ridge Ct
- 4006 Clover Ridge Ct
- 4028 Stock Ave
- 4031 Clover Ridge Ct
- 5916 Clover Ln
- 5910 Clover Ln
- 5904 Clover Ln
- 5924 Clover Ln
- 4028 Clover Ridge Ct
- 4035 Clover Ridge Ct
- 5859 Clover Ln