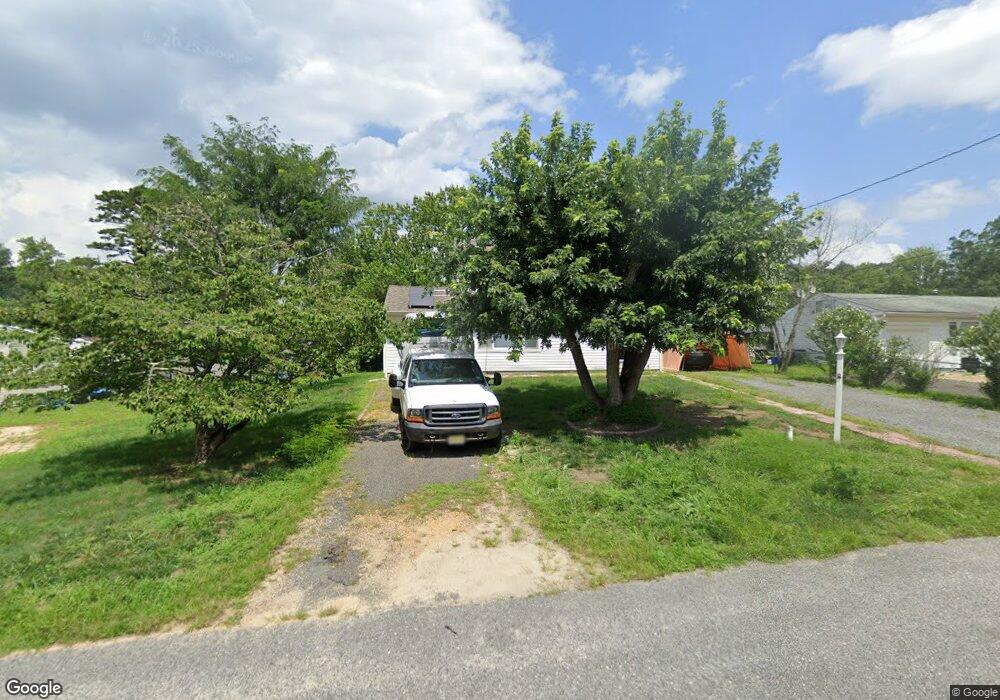
4011 E Adams Cir Hammonton, NJ 08037
Estimated Value: $181,000 - $401,000
--
Bed
--
Bath
1,320
Sq Ft
$221/Sq Ft
Est. Value
About This Home
This home is located at 4011 E Adams Cir, Hammonton, NJ 08037 and is currently estimated at $291,501, approximately $220 per square foot. 4011 E Adams Cir is a home located in Atlantic County with nearby schools including Mullica Township Primary School, Mullica Township Elementary & Middle School, and Cedar Creek High School.
Ownership History
Date
Name
Owned For
Owner Type
Purchase Details
Closed on
Jun 12, 2001
Sold by
Esau Robert J and Molina Angel
Bought by
Molina Angel and Natoli Debra
Current Estimated Value
Home Financials for this Owner
Home Financials are based on the most recent Mortgage that was taken out on this home.
Original Mortgage
$78,295
Outstanding Balance
$29,824
Interest Rate
7.14%
Mortgage Type
Purchase Money Mortgage
Estimated Equity
$261,677
Purchase Details
Closed on
Aug 29, 2000
Sold by
Lopez Digna E and Lopez James
Bought by
Hud
Purchase Details
Closed on
Mar 13, 1994
Sold by
Michaellopez
Bought by
Lopez Digna E
Home Financials for this Owner
Home Financials are based on the most recent Mortgage that was taken out on this home.
Original Mortgage
$49,000
Interest Rate
8.44%
Mortgage Type
FHA
Create a Home Valuation Report for This Property
The Home Valuation Report is an in-depth analysis detailing your home's value as well as a comparison with similar homes in the area
Home Values in the Area
Average Home Value in this Area
Purchase History
| Date | Buyer | Sale Price | Title Company |
|---|---|---|---|
| Molina Angel | -- | Surety Title Corporation | |
| Esau Robert J | $52,507 | Surety Title Corporation | |
| Hud | -- | -- | |
| Lopez Digna E | $50,000 | -- |
Source: Public Records
Mortgage History
| Date | Status | Borrower | Loan Amount |
|---|---|---|---|
| Open | Esau Robert J | $78,295 | |
| Previous Owner | Lopez Digna E | $49,000 |
Source: Public Records
Tax History Compared to Growth
Tax History
| Year | Tax Paid | Tax Assessment Tax Assessment Total Assessment is a certain percentage of the fair market value that is determined by local assessors to be the total taxable value of land and additions on the property. | Land | Improvement |
|---|---|---|---|---|
| 2025 | $3,828 | $106,400 | $22,600 | $83,800 |
| 2024 | $3,828 | $106,400 | $22,600 | $83,800 |
| 2023 | $3,629 | $106,400 | $22,600 | $83,800 |
| 2022 | $3,629 | $106,400 | $22,600 | $83,800 |
| 2021 | $3,486 | $106,400 | $22,600 | $83,800 |
| 2020 | $3,395 | $106,400 | $22,600 | $83,800 |
| 2019 | $3,327 | $106,400 | $22,600 | $83,800 |
| 2018 | $3,448 | $73,400 | $17,200 | $56,200 |
| 2017 | $3,445 | $73,400 | $17,200 | $56,200 |
| 2016 | $3,242 | $73,400 | $17,200 | $56,200 |
| 2015 | $3,081 | $73,400 | $17,200 | $56,200 |
| 2014 | $3,045 | $73,400 | $17,200 | $56,200 |
Source: Public Records
Map
Nearby Homes
- 4160 Anna Dr
- 4166 Anna Dr
- 4179 E Adams Cir
- 541 Wharton Park Blvd
- 547 Wharton Park Blvd
- 551 Wharton Park Blvd
- 4075 W Adams Cir
- 4501 S White Horse Pike
- 1021 Reading Ave
- 900 Elwood Rd
- 900 Elwood Rd Unit MULLICA TWP
- 4640 Frazier Ave
- 0 Columbia Rd Unit NJAC2012962
- 0 Columbia Rd Unit 586593
- 154 24th Ave
- 700 Columbia Rd
- 4834 White Horse Pike
- 4821 Moss Mill Rd
- 4930 Moss Mill Rd
- 3142 Moss Mill Rd
- 4007 E Adams Cir
- 4013 E Adams Cir
- 431 Arch Ln
- 4149 Anna Dr
- 4005 E Adams Cir
- 4153 Anna Dr
- 4145 Anna Dr
- 4010 E Adams Cir
- 4006 E Adams Cir
- 4006 W Adams Cir
- 4012 E Adams Cir
- 4157 Anna Dr
- 4004 E Adams Cir
- 4001 E Adams Cir
- 4001 W Adams Cir
- 4019 W Adams Cir
- 430 Arch Ln
- 4161 Anna Dr
- 4000 E Adams Cir
- 4018 W Adams Cir