Estimated Value: $428,000 - $474,000
3
Beds
2
Baths
1,382
Sq Ft
$326/Sq Ft
Est. Value
About This Home
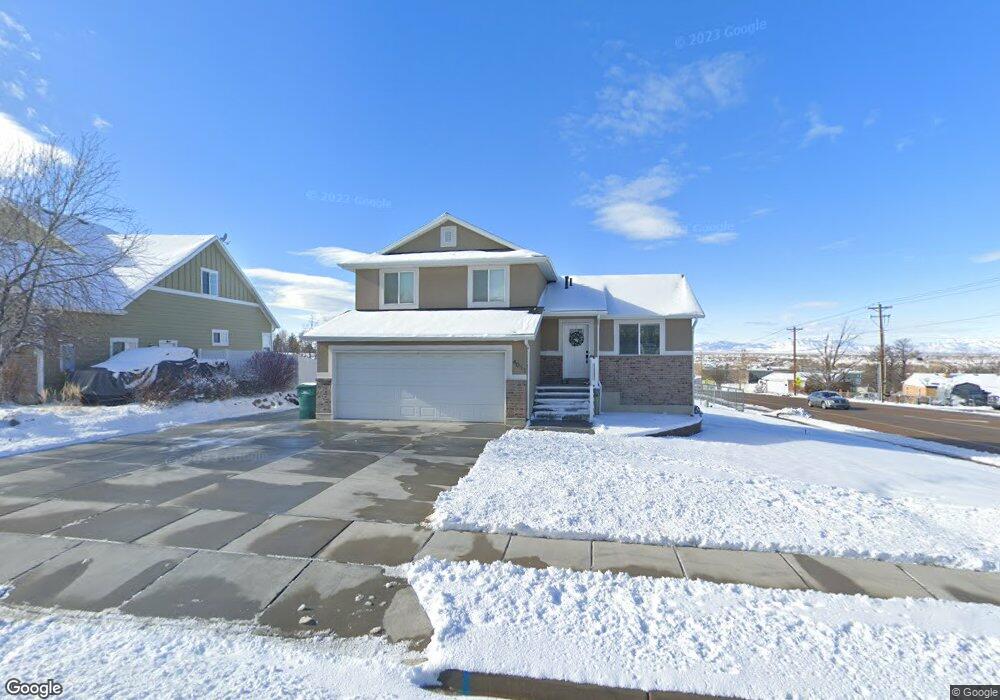
This home is located at 4011 S 2225 W Unit 81, Roy, UT 84067 and is currently estimated at $450,509, approximately $325 per square foot. 4011 S 2225 W Unit 81 is a home located in Weber County with nearby schools including North Park School, Sand Ridge Junior High School, and Roy High School.
Ownership History
Date
Name
Owned For
Owner Type
Purchase Details
Closed on
Jan 15, 2021
Sold by
Dial Ian and Dial Ciara
Bought by
Dial Ian Tyler and Dial Ciara
Current Estimated Value
Home Financials for this Owner
Home Financials are based on the most recent Mortgage that was taken out on this home.
Original Mortgage
$203,500
Outstanding Balance
$181,624
Interest Rate
2.71%
Mortgage Type
New Conventional
Estimated Equity
$268,885
Purchase Details
Closed on
Jun 13, 2016
Sold by
Nelson And Nelson Construction Inc
Bought by
Nelson And Nelson Construction Inc
Home Financials for this Owner
Home Financials are based on the most recent Mortgage that was taken out on this home.
Original Mortgage
$178,000
Interest Rate
3.57%
Mortgage Type
Construction
Create a Home Valuation Report for This Property
The Home Valuation Report is an in-depth analysis detailing your home's value as well as a comparison with similar homes in the area
Home Values in the Area
Average Home Value in this Area
Purchase History
| Date | Buyer | Sale Price | Title Company |
|---|---|---|---|
| Dial Ian Tyler | -- | Vanguard Title Ins Agcy | |
| Nelson And Nelson Construction Inc | -- | Mountain View Title | |
| Nelson And Nelson Construction Inc | -- | Mountain View Title |
Source: Public Records
Mortgage History
| Date | Status | Borrower | Loan Amount |
|---|---|---|---|
| Open | Dial Ian Tyler | $203,500 | |
| Closed | Nelson And Nelson Construction Inc | $178,000 |
Source: Public Records
Tax History Compared to Growth
Tax History
| Year | Tax Paid | Tax Assessment Tax Assessment Total Assessment is a certain percentage of the fair market value that is determined by local assessors to be the total taxable value of land and additions on the property. | Land | Improvement |
|---|---|---|---|---|
| 2025 | $2,747 | $437,842 | $157,303 | $280,539 |
| 2024 | $2,684 | $431,000 | $157,303 | $273,697 |
| 2023 | $2,863 | $465,000 | $157,930 | $307,070 |
| 2022 | $2,721 | $452,000 | $128,371 | $323,629 |
| 2021 | $2,330 | $351,000 | $83,835 | $267,165 |
| 2020 | $2,172 | $300,000 | $83,835 | $216,165 |
| 2019 | $2,155 | $281,000 | $64,076 | $216,924 |
| 2018 | $2,084 | $256,000 | $64,076 | $191,924 |
| 2017 | $2,200 | $256,000 | $63,095 | $192,905 |
| 2016 | $862 | $59,204 | $59,204 | $0 |
| 2015 | $836 | $59,204 | $59,204 | $0 |
| 2014 | $734 | $51,353 | $51,353 | $0 |
Source: Public Records
Map
Nearby Homes
- 4110 S 2275 W
- 4073 S 2175 W
- 3965 S 2225 W
- 4164 S 2400 W
- 2096 W 3950 S
- 2070 W 4000 S
- 2050 W 4000 S
- 4205 S 2075 W
- 4220 S 2075 W
- 3860 Midland Dr Unit C10
- 3860 Midland Dr Unit B32
- 1959 3985 St S Unit 2
- 3923 S 1975 W Unit 15
- 2015 W 4225 S
- 4328 S 2175 W
- 1910 W 3920 S
- 4118 Westlake Dr
- 3854 S 1925 W
- 2263 W 4400 S
- 2082 W 4450 S
- 4023 S 2225 W
- 4035 S 2225 W
- 4035 S 2225 W Unit 79
- 4012 S 2225 W Unit 74
- 3991 S 2225 W
- 2250 W 4000 S
- 4024 S 2225 W
- 4024 S 2225 W Unit 75
- 2220 W 4000 S
- 4049 S 2225 W
- 3998 S 2275 W
- 3985 S 2225 W
- 3992 S 2275 W
- 4036 S 2225 W Unit 76
- 4048 S 2225 W
- 4048 S 2225 W Unit 77
- 2190 W 4000 S
- 4037 S 2175 W
- 3980 S 2225 W
- 3975 S 2225 W