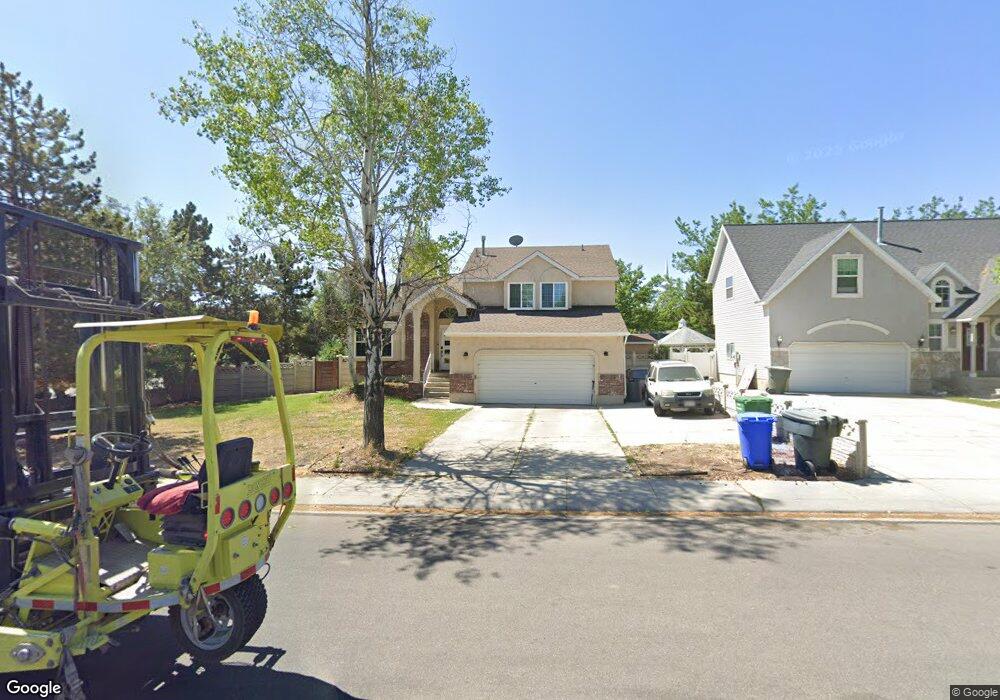
4011 S Laurel Ridge West Jordan, UT 84088
Jordan Oaks NeighborhoodEstimated Value: $544,408 - $605,000
3
Beds
3
Baths
2,081
Sq Ft
$275/Sq Ft
Est. Value
About This Home
This home is located at 4011 S Laurel Ridge, West Jordan, UT 84088 and is currently estimated at $573,102, approximately $275 per square foot. 4011 S Laurel Ridge is a home located in Salt Lake County with nearby schools including Welby Elementary School, Elk Ridge Middle School, and Itineris Early College High School.
Ownership History
Date
Name
Owned For
Owner Type
Purchase Details
Closed on
Jul 13, 2020
Sold by
Ortiz Richard
Bought by
Ortiz Richard A
Current Estimated Value
Home Financials for this Owner
Home Financials are based on the most recent Mortgage that was taken out on this home.
Original Mortgage
$222,000
Outstanding Balance
$196,855
Interest Rate
3.1%
Mortgage Type
New Conventional
Estimated Equity
$376,247
Purchase Details
Closed on
Oct 13, 2011
Sold by
Gormley Joshua
Bought by
Ortiz Richard
Home Financials for this Owner
Home Financials are based on the most recent Mortgage that was taken out on this home.
Original Mortgage
$191,031
Interest Rate
3.87%
Mortgage Type
FHA
Purchase Details
Closed on
Mar 26, 2011
Sold by
Rodriguez Erick J
Bought by
Gormley Joshua
Create a Home Valuation Report for This Property
The Home Valuation Report is an in-depth analysis detailing your home's value as well as a comparison with similar homes in the area
Home Values in the Area
Average Home Value in this Area
Purchase History
| Date | Buyer | Sale Price | Title Company |
|---|---|---|---|
| Ortiz Richard A | -- | Sutherland Title | |
| Ortiz Richard | -- | Equity Title | |
| Gormley Joshua | $123,001 | Accommodation |
Source: Public Records
Mortgage History
| Date | Status | Borrower | Loan Amount |
|---|---|---|---|
| Open | Ortiz Richard A | $222,000 | |
| Closed | Ortiz Richard | $191,031 |
Source: Public Records
Tax History Compared to Growth
Tax History
| Year | Tax Paid | Tax Assessment Tax Assessment Total Assessment is a certain percentage of the fair market value that is determined by local assessors to be the total taxable value of land and additions on the property. | Land | Improvement |
|---|---|---|---|---|
| 2025 | $2,427 | $482,400 | $169,500 | $312,900 |
| 2024 | $2,427 | $467,000 | $164,000 | $303,000 |
| 2023 | $2,465 | $447,000 | $160,800 | $286,200 |
| 2022 | $2,557 | $456,100 | $157,600 | $298,500 |
| 2021 | $2,142 | $347,800 | $118,200 | $229,600 |
| 2020 | $1,933 | $294,600 | $106,400 | $188,200 |
| 2019 | $1,944 | $290,500 | $106,400 | $184,100 |
| 2018 | $1,808 | $268,000 | $105,400 | $162,600 |
| 2017 | $1,697 | $250,500 | $105,400 | $145,100 |
| 2016 | $1,693 | $234,800 | $105,400 | $129,400 |
| 2015 | $1,634 | $220,900 | $120,200 | $100,700 |
| 2014 | $1,560 | $207,600 | $114,500 | $93,100 |
Source: Public Records
Map
Nearby Homes
- 9375 S Laurel Ridge Cir
- 3750 W Bingham Creek Dr
- 3702 W Angus Dr
- 3908 W Graymalkin Cir
- 9634 Elk Vista Ln
- 8983 S 3860 W
- 9353 S 4460 W
- 9526 Ember Glow Ct Unit C
- 9566 Ember Glow Ct Unit C
- 4424 W Skye Dr
- 9871 S 4000 W
- 4565 Lennox Dr
- 3931 W Dansere Cir
- 9941 Birnam Woods Way
- 4707 W Granada Hills Ct
- 3888 W 8700 S
- 4058 W Ascot Downs Dr
- 3256 Star Fire Rd
- 4554 Birdie Way
- 3827 W Country Squire Dr
- 4011 Laurel Ridge Dr
- 4025 W Laurel Ridge Dr
- 4025 Laurel Ridge Dr
- 4033 W Laurel Ridge Dr
- 4033 Laurel Ridge Dr
- 4010 W Laurel Ridge Dr
- 4010 Laurel Ridge Dr
- 4020 W Laurel Ridge Dr
- 9345 S 4000 W
- 4022 Laurel Ridge Dr
- 9361 S 4000 W
- 4045 W Laurel Ridge Dr
- 4045 Laurel Ridge Dr
- 4032 Laurel Ridge Dr
- 4032 W Laurel Ridge Dr
- 9373 S 4000 W
- 4044 Laurel Ridge Dr
- 4059 W Laurel Ridge Dr
- 4059 Laurel Ridge Dr
- 4056 Laurel Ridge Dr