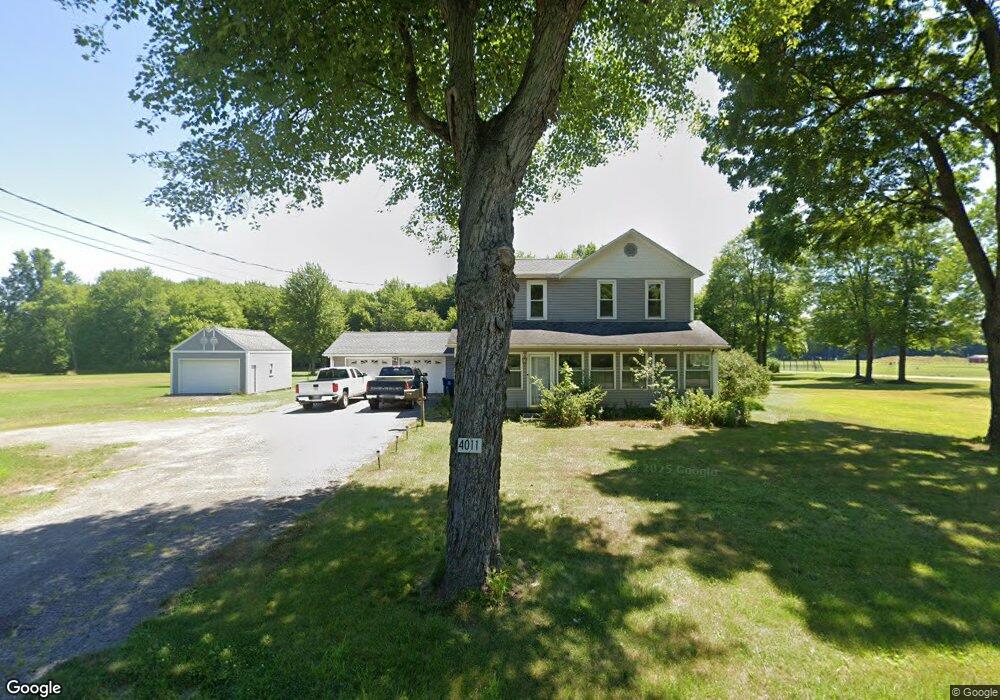
4011 S Main St Hubbard, OH 44425
Estimated Value: $179,000 - $324,554
4
Beds
2
Baths
3,253
Sq Ft
$75/Sq Ft
Est. Value
About This Home
This home is located at 4011 S Main St, Hubbard, OH 44425 and is currently estimated at $244,185, approximately $75 per square foot. 4011 S Main St is a home located in Trumbull County with nearby schools including Hubbard Elementary School, Hubbard Middle School, and Hubbard High School.
Ownership History
Date
Name
Owned For
Owner Type
Purchase Details
Closed on
Oct 6, 2015
Sold by
John J Flen J
Bought by
Flen Joan
Current Estimated Value
Home Financials for this Owner
Home Financials are based on the most recent Mortgage that was taken out on this home.
Interest Rate
3.85%
Purchase Details
Closed on
Apr 18, 2006
Sold by
Flen Lillian and Flen Peter
Bought by
Flen John J and Flen Joan
Purchase Details
Closed on
Jan 1, 1990
Sold by
Flen Peter
Bought by
Joseph E Chesney and John S
Create a Home Valuation Report for This Property
The Home Valuation Report is an in-depth analysis detailing your home's value as well as a comparison with similar homes in the area
Home Values in the Area
Average Home Value in this Area
Purchase History
| Date | Buyer | Sale Price | Title Company |
|---|---|---|---|
| Flen Joan | -- | -- | |
| Flen John J | -- | None Available | |
| Joseph E Chesney | -- | -- |
Source: Public Records
Mortgage History
| Date | Status | Borrower | Loan Amount |
|---|---|---|---|
| Closed | Flen John J | -- |
Source: Public Records
Tax History Compared to Growth
Tax History
| Year | Tax Paid | Tax Assessment Tax Assessment Total Assessment is a certain percentage of the fair market value that is determined by local assessors to be the total taxable value of land and additions on the property. | Land | Improvement |
|---|---|---|---|---|
| 2024 | $4,470 | $73,360 | $18,270 | $55,090 |
| 2023 | $4,257 | $73,360 | $18,270 | $55,090 |
| 2022 | $3,700 | $56,780 | $16,840 | $39,940 |
| 2021 | $3,715 | $56,780 | $16,840 | $39,940 |
| 2020 | $3,730 | $56,780 | $16,840 | $39,940 |
| 2019 | $3,488 | $50,300 | $15,580 | $34,720 |
| 2018 | $3,387 | $50,300 | $15,580 | $34,720 |
| 2017 | $3,378 | $50,300 | $15,580 | $34,720 |
| 2016 | $2,671 | $41,660 | $15,580 | $26,080 |
| 2015 | $2,680 | $41,660 | $15,580 | $26,080 |
| 2014 | $2,630 | $41,660 | $15,580 | $26,080 |
| 2013 | $2,625 | $41,660 | $15,580 | $26,080 |
Source: Public Records
Map
Nearby Homes
- 2954 Megan Cir
- 2951 Megan Cir
- 2051 Blair Ave
- 665 Wendemere Dr
- 531 Meadowland Dr
- 663 Meadowland Dr
- V/L Jacobs Rd
- 1720 Jacobs Rd
- 254 Christian Ave
- 366 Westview Ave
- 279 Parish Ave
- 1214 Brighton St
- 269 Westview Ave
- 114 Oakdale Ave
- 229 Jacobs Rd
- 319 E Liberty St
- 3397 Pothour Wheeler Rd
- 126 Stewart St
- 50 Walnut St
- 110 School St