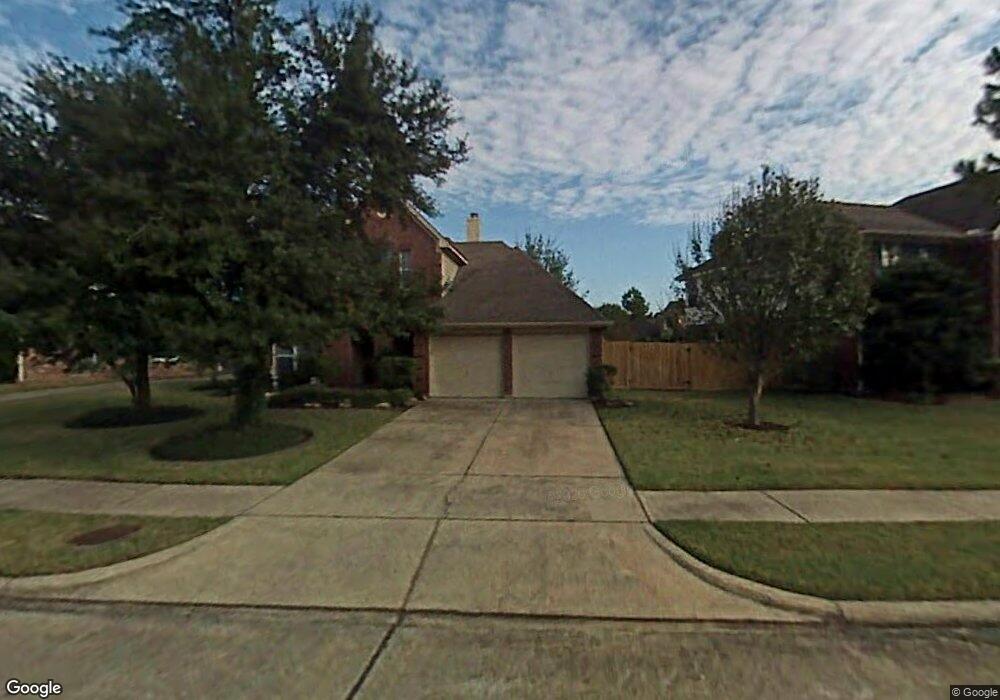
4011 Stonehurst Dr Pearland, TX 77584
Silverlake NeighborhoodEstimated Value: $332,135 - $361,000
4
Beds
3
Baths
2,057
Sq Ft
$170/Sq Ft
Est. Value
About This Home
This home is located at 4011 Stonehurst Dr, Pearland, TX 77584 and is currently estimated at $349,284, approximately $169 per square foot. 4011 Stonehurst Dr is a home located in Brazoria County with nearby schools including Massey Ranch Elementary School, Sam Jamison Middle School, and Pearland Junior High School South.
Ownership History
Date
Name
Owned For
Owner Type
Purchase Details
Closed on
May 16, 2013
Sold by
Lyssy Michael E and Lyssy Denise F
Bought by
Gonzales Laura M and Gonzales Victor A
Current Estimated Value
Home Financials for this Owner
Home Financials are based on the most recent Mortgage that was taken out on this home.
Original Mortgage
$162,993
Outstanding Balance
$114,297
Interest Rate
3.25%
Mortgage Type
FHA
Estimated Equity
$234,987
Purchase Details
Closed on
Dec 2, 2011
Sold by
Lyssy Julie L
Bought by
Lyssy Michael E
Home Financials for this Owner
Home Financials are based on the most recent Mortgage that was taken out on this home.
Original Mortgage
$165,000
Interest Rate
4.03%
Mortgage Type
Assumption
Purchase Details
Closed on
Jul 24, 1997
Sold by
Emerald Builders Ltd
Bought by
Lyssy Michael E and Lyssy Julie L
Home Financials for this Owner
Home Financials are based on the most recent Mortgage that was taken out on this home.
Original Mortgage
$114,250
Interest Rate
7.72%
Create a Home Valuation Report for This Property
The Home Valuation Report is an in-depth analysis detailing your home's value as well as a comparison with similar homes in the area
Home Values in the Area
Average Home Value in this Area
Purchase History
| Date | Buyer | Sale Price | Title Company |
|---|---|---|---|
| Gonzales Laura M | -- | Alamo Title Company | |
| Lyssy Michael E | -- | None Available | |
| Lyssy Michael E | -- | Chicago Title |
Source: Public Records
Mortgage History
| Date | Status | Borrower | Loan Amount |
|---|---|---|---|
| Open | Gonzales Laura M | $162,993 | |
| Previous Owner | Lyssy Michael E | $165,000 | |
| Previous Owner | Lyssy Michael E | $114,250 |
Source: Public Records
Tax History Compared to Growth
Tax History
| Year | Tax Paid | Tax Assessment Tax Assessment Total Assessment is a certain percentage of the fair market value that is determined by local assessors to be the total taxable value of land and additions on the property. | Land | Improvement |
|---|---|---|---|---|
| 2025 | $3,912 | $330,220 | $79,180 | $251,040 |
| 2023 | $3,912 | $298,253 | $79,180 | $245,620 |
| 2022 | $6,035 | $271,139 | $35,450 | $237,690 |
| 2021 | $6,277 | $246,490 | $32,230 | $214,260 |
| 2020 | $5,752 | $230,450 | $32,230 | $198,220 |
| 2019 | $5,296 | $205,300 | $32,230 | $173,070 |
| 2018 | $5,239 | $202,130 | $32,230 | $169,900 |
| 2017 | $5,550 | $212,730 | $32,230 | $180,500 |
| 2016 | $5,217 | $214,820 | $32,230 | $182,590 |
| 2014 | $4,204 | $171,970 | $32,230 | $139,740 |
Source: Public Records
Map
Nearby Homes
- 3310 E Overdale Dr
- 0 Bailey Rd Unit 89982715
- 3615 Rivers Rd
- 3722 Paigewood Dr
- 4146 S Webber Dr
- 3739 Crescent Dr
- 3731 Crescent Dr
- 3606 Miraglen Dr
- 2923 Elsbury Ln
- 3901 Magnolia Pkwy
- 4026 Bentley Dr
- 18685 Tree Top Ln
- 18660 Tree Top Ln
- 3602 Chesapeake Ct
- 00 Bailey Rd
- 4311 Duesenberg Ct
- 3307 Lawson Dr
- 3143 Edgewood Dr
- 4531 Curry St
- 0 Bailey Rd
- 4007 Stonehurst Dr
- 4023 Stonehurst Dr
- 3326 Ridgepoint Ct
- 4027 Stonehurst Dr
- 4003 Stonehurst Dr
- 4014 Karrywood Stonehurst Ct
- 4014 Stonehurst Dr
- 3323 Ridgepoint Ct
- 3322 Ridgepoint Ct
- 4018 Stonehurst Dr
- 4022 Stonehurst Dr
- 4031 Stonehurst Dr
- 3335 Harbrook Dr
- 4010 Stonehurst Dr
- 3934 Karrywood Ct
- 4026 Stonehurst Dr
- 3319 Ridgepoint Ct
- 3318 Ridgepoint Ct
- 4006 Stonehurst Dr
- 3331 Harbrook Dr