Estimated Value: $250,947 - $283,000
3
Beds
2
Baths
1,331
Sq Ft
$198/Sq Ft
Est. Value
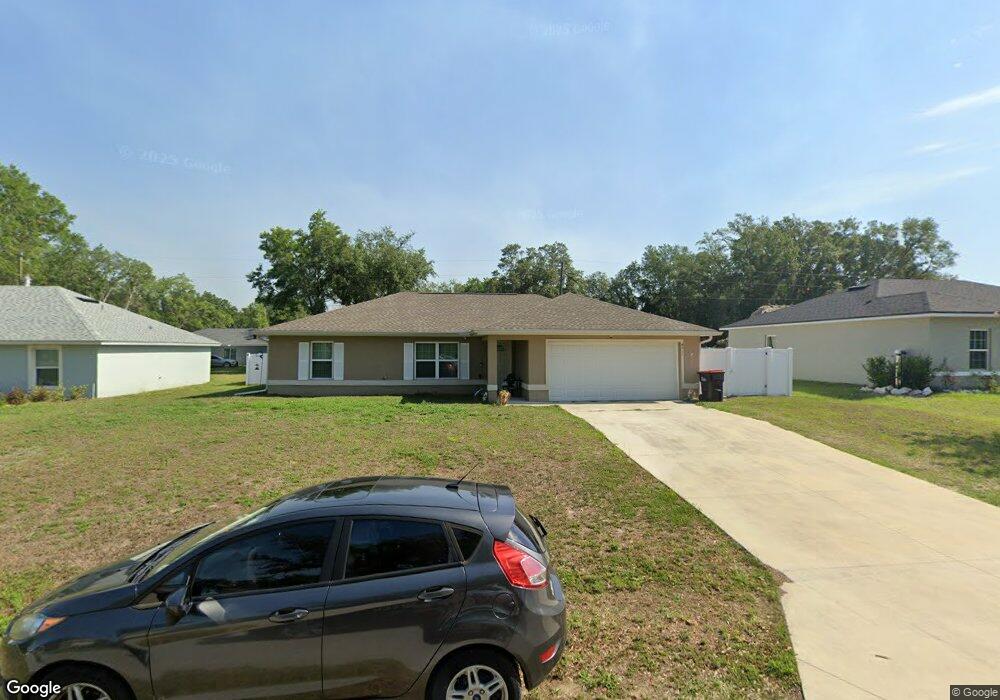
About This Home
This home is located at 4011 SW 130th Loop, Ocala, FL 34473 and is currently estimated at $262,987, approximately $197 per square foot. 4011 SW 130th Loop is a home located in Marion County with nearby schools including Marion Oaks Elementary School, Horizon Academy At Marion Oaks, and West Port High School.
Ownership History
Date
Name
Owned For
Owner Type
Purchase Details
Closed on
Oct 24, 2023
Sold by
Gandhi Trupti
Bought by
Hardin David Edward
Current Estimated Value
Home Financials for this Owner
Home Financials are based on the most recent Mortgage that was taken out on this home.
Original Mortgage
$242,673
Outstanding Balance
$237,290
Interest Rate
7.18%
Mortgage Type
FHA
Estimated Equity
$25,697
Purchase Details
Closed on
Aug 15, 2018
Sold by
Worldwide Alliance Llc
Bought by
Gandhi Trupti
Home Financials for this Owner
Home Financials are based on the most recent Mortgage that was taken out on this home.
Original Mortgage
$110,320
Interest Rate
5.12%
Mortgage Type
Adjustable Rate Mortgage/ARM
Purchase Details
Closed on
Jan 22, 2018
Sold by
Watte Albert
Bought by
World Wide Alliance Llc
Purchase Details
Closed on
Dec 26, 2006
Sold by
Marco Polo Builders Inc
Bought by
Waite Albert
Create a Home Valuation Report for This Property
The Home Valuation Report is an in-depth analysis detailing your home's value as well as a comparison with similar homes in the area
Home Values in the Area
Average Home Value in this Area
Purchase History
| Date | Buyer | Sale Price | Title Company |
|---|---|---|---|
| Hardin David Edward | $265,000 | Marion Lake Sumter Title | |
| Hardin David Edward | $265,000 | Marion Lake Sumter Title | |
| Gandhi Trupti | $137,900 | 1St Quality Title Llc | |
| World Wide Alliance Llc | $5,000 | Americas Title Corp | |
| Waite Albert | -- | None Available |
Source: Public Records
Mortgage History
| Date | Status | Borrower | Loan Amount |
|---|---|---|---|
| Open | Hardin David Edward | $242,673 | |
| Closed | Hardin David Edward | $242,673 | |
| Previous Owner | Gandhi Trupti | $110,320 |
Source: Public Records
Tax History
| Year | Tax Paid | Tax Assessment Tax Assessment Total Assessment is a certain percentage of the fair market value that is determined by local assessors to be the total taxable value of land and additions on the property. | Land | Improvement |
|---|---|---|---|---|
| 2025 | $1,998 | $125,003 | -- | -- |
| 2024 | $1,755 | $121,480 | -- | -- |
| 2023 | $3,435 | $158,929 | $0 | $0 |
| 2022 | $3,163 | $144,481 | $0 | $0 |
| 2021 | $2,671 | $131,346 | $9,350 | $121,996 |
| 2020 | $2,601 | $126,391 | $8,500 | $117,891 |
| 2019 | $2,564 | $123,028 | $7,200 | $115,828 |
| 2018 | $185 | $5,950 | $5,950 | $0 |
| 2017 | $168 | $4,250 | $4,250 | $0 |
| 2016 | $174 | $4,400 | $0 | $0 |
| 2015 | $166 | $4,000 | $0 | $0 |
| 2014 | $167 | $3,850 | $0 | $0 |
Source: Public Records
Map
Nearby Homes
- 4031 SW 130th Loop
- 0 0 Sw 43rd Cir Unit MFRO6381350
- TBD SW 43 Avenue Rd
- 237 Marion Oaks Trail
- 13028 SW 43rd Avenue Rd
- 12970 SW 43rd Avenue Rd
- 4198 SW 128th Place
- 0 SW 43 Ave Unit MFRO6367849
- 13215 SW 41st Ct
- 12841 SW 43rd Cir
- 0 SW 132nd St Unit MFROM673518
- 0 SW 132nd St Unit MFROM718354
- 0 SW 41 Ct
- 0 SW 130 Place Unit MFROM713242
- 216 Marion Oaks Trail
- 4094 SW 132nd Ln
- 105 Marion Oaks Course
- 4064 SW 132nd Ln
- 3749 SW 130th Loop
- 4052 SW 132nd Ln
- 4011 SW 130th Loop
- 4011 SW 130th Loop
- 4001 SW 130th Loop
- 4021 SW 130th Loop
- 252 Marion Oaks Trail
- 3991 SW 130th Loop
- 3996 SW 130th Loop
- 4056 SW 130th Loop
- 3986 SW 130th Loop
- 0000 SW 43 Avenue Rd
- 0 0 Sw 43rd Cir Unit OM634200
- 3971 SW 130th Loop
- 3976 SW 130th Loop
- 12781 SW 43rd Cir
- 4070 SW 130th Loop
- 12930 SW 40th Terrace
- 12780 SW 43rd Cir
- 4097 SW 130th Place
- 4115 SW 130th Place
- 4051 SW 130th Loop Unit 7
Your Personal Tour Guide
Ask me questions while you tour the home.