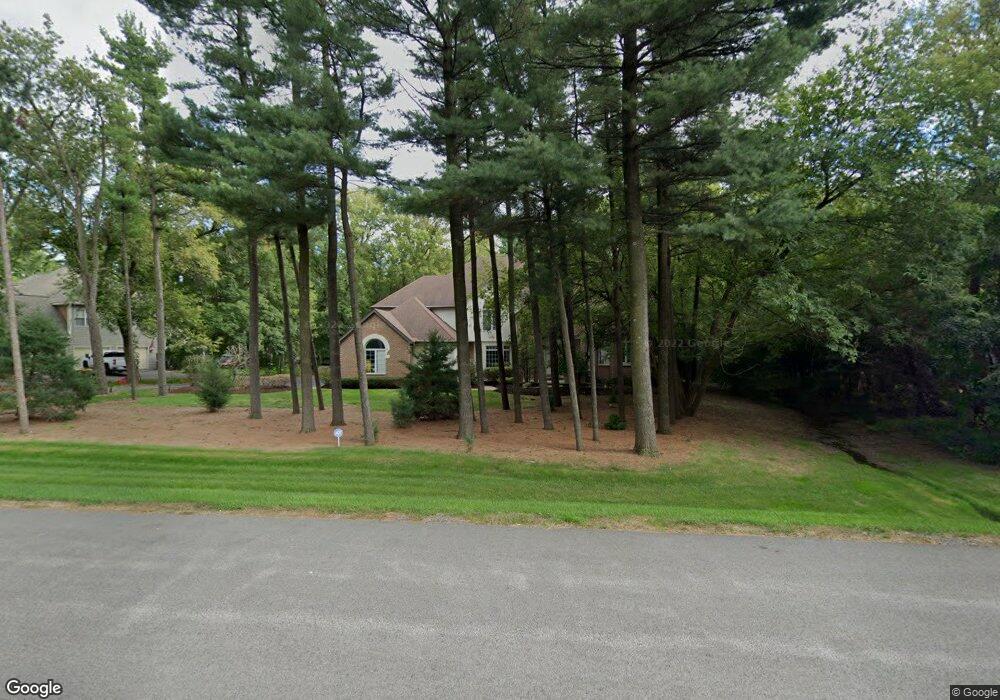
4011 Terry Ave Crystal Lake, IL 60014
Estimated Value: $645,973 - $815,000
4
Beds
5
Baths
3,799
Sq Ft
$186/Sq Ft
Est. Value
About This Home
This home is located at 4011 Terry Ave, Crystal Lake, IL 60014 and is currently estimated at $705,993, approximately $185 per square foot. 4011 Terry Ave is a home located in McHenry County with nearby schools including Prairie Grove Elementary School, Prairie Grove Junior High School, and Prairie Ridge High School.
Ownership History
Date
Name
Owned For
Owner Type
Purchase Details
Closed on
May 6, 2002
Sold by
Cendant Mobility Financial Corp
Bought by
Venkataswamy Krishna and Venkataswamy Shiela
Current Estimated Value
Home Financials for this Owner
Home Financials are based on the most recent Mortgage that was taken out on this home.
Original Mortgage
$376,000
Outstanding Balance
$160,333
Interest Rate
7.07%
Estimated Equity
$545,660
Purchase Details
Closed on
Dec 10, 2001
Sold by
Mendell Robert W and Mendell Judith A
Bought by
Cendant Mobility Financial Corp
Purchase Details
Closed on
Oct 21, 1994
Sold by
The Mchenry State Bank
Bought by
Mendell Robert W and Mendell Judith A
Home Financials for this Owner
Home Financials are based on the most recent Mortgage that was taken out on this home.
Original Mortgage
$387,000
Interest Rate
6.75%
Purchase Details
Closed on
Dec 9, 1993
Sold by
Mchenry State Bank
Bought by
Mchenry State Bank and Trust #12434
Create a Home Valuation Report for This Property
The Home Valuation Report is an in-depth analysis detailing your home's value as well as a comparison with similar homes in the area
Home Values in the Area
Average Home Value in this Area
Purchase History
| Date | Buyer | Sale Price | Title Company |
|---|---|---|---|
| Venkataswamy Krishna | $470,000 | -- | |
| Cendant Mobility Financial Corp | $510,000 | -- | |
| Mendell Robert W | $430,000 | Intercounty Title | |
| Mchenry State Bank | $89,000 | -- |
Source: Public Records
Mortgage History
| Date | Status | Borrower | Loan Amount |
|---|---|---|---|
| Open | Venkataswamy Krishna | $376,000 | |
| Previous Owner | Mendell Robert W | $387,000 |
Source: Public Records
Tax History Compared to Growth
Tax History
| Year | Tax Paid | Tax Assessment Tax Assessment Total Assessment is a certain percentage of the fair market value that is determined by local assessors to be the total taxable value of land and additions on the property. | Land | Improvement |
|---|---|---|---|---|
| 2024 | $12,597 | $166,252 | $33,359 | $132,893 |
| 2023 | $12,446 | $149,092 | $29,916 | $119,176 |
| 2022 | $14,600 | $167,577 | $29,919 | $137,658 |
| 2021 | $13,788 | $157,113 | $28,051 | $129,062 |
| 2020 | $13,601 | $152,404 | $27,210 | $125,194 |
| 2019 | $13,285 | $144,898 | $25,870 | $119,028 |
| 2018 | $14,302 | $153,634 | $30,651 | $122,983 |
| 2017 | $14,037 | $147,187 | $29,365 | $117,822 |
| 2016 | $13,904 | $140,432 | $28,017 | $112,415 |
| 2013 | -- | $133,649 | $26,664 | $106,985 |
Source: Public Records
Map
Nearby Homes
- 5412 Gerry Ln
- 4210 Jacqueline Ln
- 5805 Wild Plum Rd
- 5305 Rita Ave
- 5419 Rita Ave
- 5609 Farmbrook Ln
- Lot#34 White Ash Rd
- 642 Cassia Ct
- 690 Cassia Ct
- 672 Cassia Ct
- 646 Cassia Ct
- 656 Cassia Ct
- 5912 Prairie Ridge Rd
- 1117 Black Cherry Dr
- 4119 White Ash Rd
- 1101 Black Cherry Dr
- 845 E Terra Cotta Ave
- 546 Cimmaron Cir
- 3814 Church Hill Ln
- 6102 Scott Ln
- 4003 Terry Ave
- 4015 Terry Ave
- 3917 Terry Ave
- 4010 Terry Ave
- 4009 E Terra Cotta Ave
- 4016 Terry Ave
- 5510 Renee Ave
- 4002 Terry Ave
- 5608 Smith Rd
- 4003 E Terra Cotta Ave
- 3913 Terry Ave
- 5417 Gerry Ln
- 5506 Renee Ave
- 5607 Jay Dr
- 5514 Renee Ave
- 5418 Renee Ave
- 4008 Chris Ln
- 4016 Chris Ln
- 3907 Terry Ave
- 4011 Ned Dr