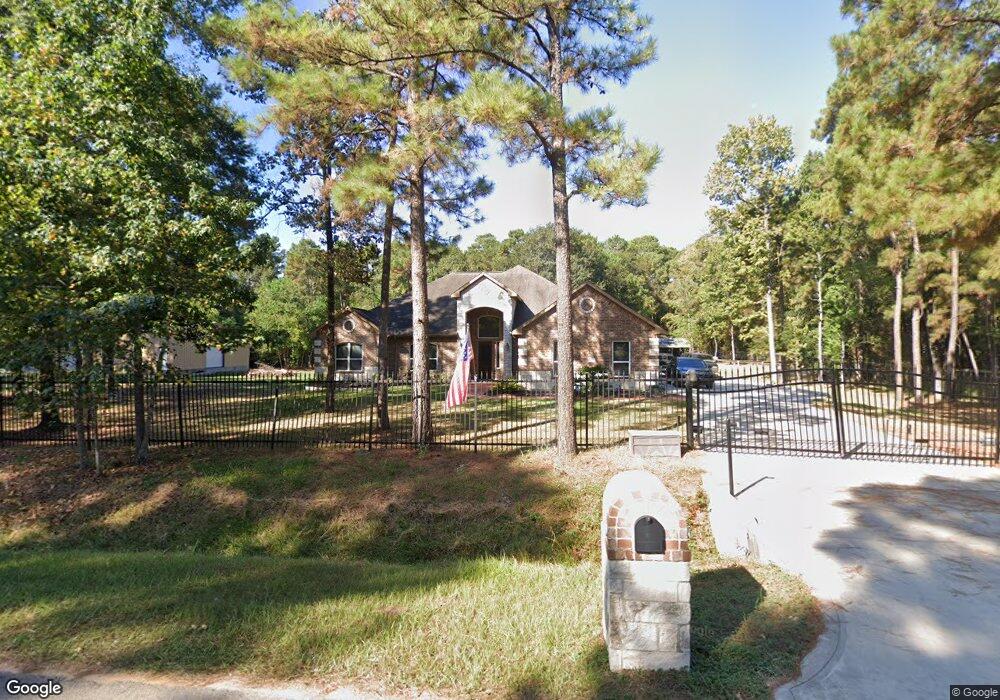
40111 Pipestone Rd Magnolia, TX 77354
Estimated Value: $726,000 - $880,000
4
Beds
4
Baths
3,650
Sq Ft
$220/Sq Ft
Est. Value
About This Home
This home is located at 40111 Pipestone Rd, Magnolia, TX 77354 and is currently estimated at $802,546, approximately $219 per square foot. 40111 Pipestone Rd is a home located in Montgomery County with nearby schools including Bear Branch Elementary School, Bear Branch Junior High School, and Magnolia High School.
Ownership History
Date
Name
Owned For
Owner Type
Purchase Details
Closed on
Feb 24, 2017
Sold by
Omg Development Llc
Bought by
Smith Steven and Smith Susan
Current Estimated Value
Purchase Details
Closed on
Aug 15, 2016
Sold by
Omg Development Llc
Bought by
Smith Steven J and Smith Susan L
Home Financials for this Owner
Home Financials are based on the most recent Mortgage that was taken out on this home.
Original Mortgage
$340,000
Interest Rate
3.48%
Mortgage Type
New Conventional
Purchase Details
Closed on
Oct 29, 2014
Sold by
Rendon Joaquin and Rendon Petra
Bought by
Smith Steven J and Smith Susan L
Purchase Details
Closed on
May 29, 2003
Sold by
Parr Family Lp
Bought by
Rendon Joaquin
Create a Home Valuation Report for This Property
The Home Valuation Report is an in-depth analysis detailing your home's value as well as a comparison with similar homes in the area
Home Values in the Area
Average Home Value in this Area
Purchase History
| Date | Buyer | Sale Price | Title Company |
|---|---|---|---|
| Smith Steven | -- | Momentum Title Llc | |
| Smith Steven J | -- | Momentum Title Llc | |
| Smith Steven J | -- | -- | |
| Rendon Joaquin | -- | Stewart Title |
Source: Public Records
Mortgage History
| Date | Status | Borrower | Loan Amount |
|---|---|---|---|
| Previous Owner | Smith Steven J | $340,000 |
Source: Public Records
Tax History Compared to Growth
Tax History
| Year | Tax Paid | Tax Assessment Tax Assessment Total Assessment is a certain percentage of the fair market value that is determined by local assessors to be the total taxable value of land and additions on the property. | Land | Improvement |
|---|---|---|---|---|
| 2025 | $9,485 | $771,702 | -- | -- |
| 2024 | $8,515 | $701,547 | -- | -- |
| 2023 | $8,515 | $637,770 | $136,810 | $613,750 |
| 2022 | $10,231 | $579,790 | $135,100 | $562,900 |
| 2021 | $9,797 | $527,080 | $76,530 | $460,220 |
| 2020 | $9,697 | $479,160 | $76,530 | $438,470 |
| 2019 | $8,773 | $435,600 | $76,530 | $359,070 |
| 2018 | $8,063 | $418,870 | $36,100 | $382,770 |
| 2017 | $9,012 | $425,000 | $44,240 | $380,760 |
| 2016 | $10,351 | $488,130 | $44,240 | $443,890 |
| 2015 | $193 | $22,120 | $22,120 | $0 |
| 2014 | $193 | $9,010 | $9,010 | $0 |
Source: Public Records
Map
Nearby Homes
- 7119 Durango Dr
- 40317 De Sota Rd
- 40108 Cimarron Way
- 7455 Durango Creek Dr
- 7010 Durango Dr
- 40207 Cimarron Way
- 39526 Cimarron Way
- 7022 Dillon Dr
- 6902 Woodland Oaks
- 6906 Grant Dr
- 6818 Woodland Oaks
- 8710 Linn Ln
- 40715 Pipestone Rd
- 40319 Three Forks Rd
- 00 Magnolia Cir
- 7203 Cool Springs Ct
- 6910 Woodland Oaks
- 7002 Durango Creek Dr
- 247 Brazen Forest Trail
- 222 Brazen Forest Trail
- 40114 Pipestone Rd
- 40206 Pipestone Rd
- 40202 De Sota Rd
- 40018 Pipestone Rd
- 8218 Deer Lodge Rd
- 40122 De Sota Rd
- 8210 Deer Lodge Rd
- 40214 De Sota Rd
- 40202 Pipestone Rd
- 40014 Pipestone Rd
- 823 Carson Dr
- 827 Carson Dr
- 819 Carson Dr
- 815 Carson Dr
- 907 Carson Dr
- 811 Carson Dr
- 911 Carson Dr
- 807 Carson Dr
- 40114 De Sota Rd
- 40006 Pipestone Rd