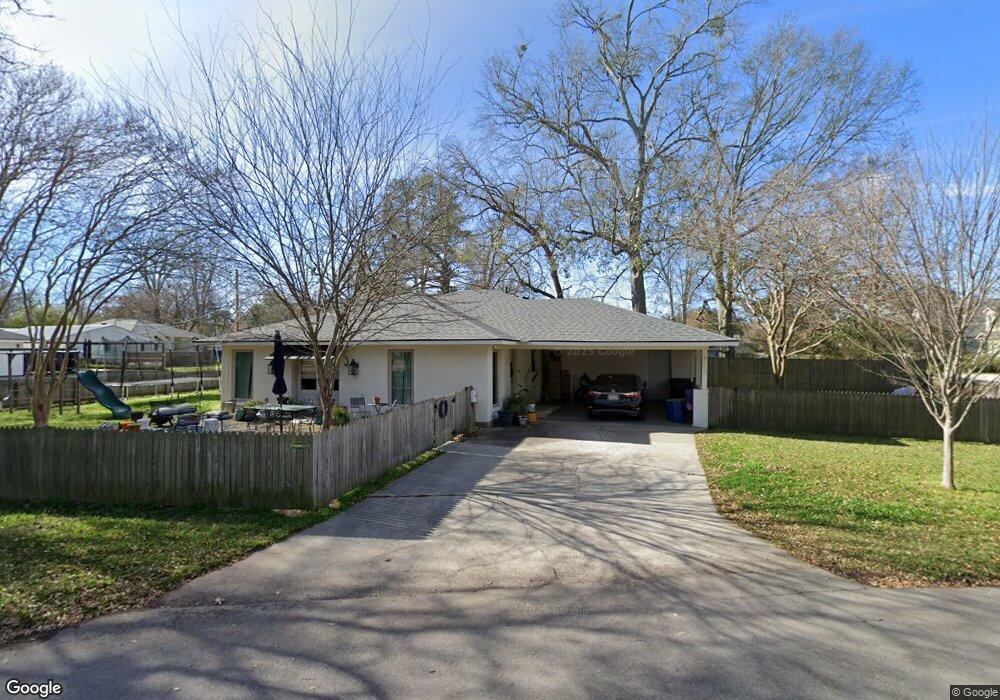
4012 Mimosa St Baton Rouge, LA 70808
Highlands/Perkins NeighborhoodEstimated Value: $338,080 - $437,000
--
Bed
--
Bath
1,590
Sq Ft
$240/Sq Ft
Est. Value
About This Home
This home is located at 4012 Mimosa St, Baton Rouge, LA 70808 and is currently estimated at $381,770, approximately $240 per square foot. 4012 Mimosa St is a home located in East Baton Rouge Parish with nearby schools including Buchanan Elementary School, Glasgow Middle School, and Mckinley Senior High School.
Ownership History
Date
Name
Owned For
Owner Type
Purchase Details
Closed on
Mar 23, 2020
Sold by
Lanase Matthew James and Lanasa Whitney Little
Bought by
Lanasa Georgia Ann
Current Estimated Value
Home Financials for this Owner
Home Financials are based on the most recent Mortgage that was taken out on this home.
Original Mortgage
$309,294
Outstanding Balance
$273,924
Interest Rate
3.5%
Mortgage Type
FHA
Estimated Equity
$107,846
Purchase Details
Closed on
Feb 6, 2018
Sold by
Wm Interest Llc A Limited Liability Comp
Bought by
Lanasa Ii Matthew James and Lanasa Whitney Brianne
Purchase Details
Closed on
Aug 28, 2017
Sold by
Jacob John Kenneth and Jacob Juanita S
Bought by
Lanasa Ii Matthew James and Lanasa Whitney Little
Home Financials for this Owner
Home Financials are based on the most recent Mortgage that was taken out on this home.
Original Mortgage
$160,000
Interest Rate
4.03%
Mortgage Type
New Conventional
Purchase Details
Closed on
May 19, 2009
Sold by
Jacob Patricia H
Bought by
Jacob John K
Create a Home Valuation Report for This Property
The Home Valuation Report is an in-depth analysis detailing your home's value as well as a comparison with similar homes in the area
Home Values in the Area
Average Home Value in this Area
Purchase History
| Date | Buyer | Sale Price | Title Company |
|---|---|---|---|
| Lanasa Georgia Ann | $315,000 | Partners Title | |
| Lanasa Ii Matthew James | -- | None Available | |
| Lanasa Ii Matthew James | $200,000 | Partners Title | |
| Jacob John K | $98,437 | -- |
Source: Public Records
Mortgage History
| Date | Status | Borrower | Loan Amount |
|---|---|---|---|
| Open | Lanasa Georgia Ann | $309,294 | |
| Previous Owner | Lanasa Ii Matthew James | $160,000 |
Source: Public Records
Tax History Compared to Growth
Tax History
| Year | Tax Paid | Tax Assessment Tax Assessment Total Assessment is a certain percentage of the fair market value that is determined by local assessors to be the total taxable value of land and additions on the property. | Land | Improvement |
|---|---|---|---|---|
| 2024 | $2,717 | $29,930 | $2,500 | $27,430 |
| 2023 | $2,717 | $29,930 | $2,500 | $27,430 |
| 2022 | $3,574 | $29,930 | $2,500 | $27,430 |
| 2021 | $3,492 | $29,930 | $2,500 | $27,430 |
| 2020 | $2,580 | $22,260 | $2,500 | $19,760 |
| 2019 | $2,422 | $20,000 | $2,500 | $17,500 |
| 2018 | $2,392 | $20,000 | $2,500 | $17,500 |
| 2017 | $1,974 | $16,500 | $2,500 | $14,000 |
| 2016 | $1,925 | $16,500 | $2,500 | $14,000 |
| 2015 | $1,517 | $13,000 | $2,500 | $10,500 |
| 2014 | $1,512 | $13,000 | $2,500 | $10,500 |
| 2013 | -- | $13,000 | $2,500 | $10,500 |
Source: Public Records
Map
Nearby Homes
- 1828 Cloverdale Ave
- 4013 Hyacinth Ave
- 4025 Perkins Lane Alley
- 1505 Stuart Ave
- 2089 Pickett Ave
- 1525 Hood Ave
- 2212 Idle Oaks Dr
- 4243 Poplar St
- 4328 Cypress St
- 1745 Lee Dr
- 2182 Stanford Ave
- 1421 Pickett Ave
- 1824 Myrtledale Ave
- 4492 Hyacinth Ave
- 2024 Myrtledale Ave
- 1509 Stanford Ave Unit A3
- 4518 Hyacinth Ave
- 3381 E Lakeshore Dr
- 4623 Arrowhead St
- 4638 Orchid St
- 1855 Anglo St
- LOT 25 Mimosa Ave
- LOT 20 Mimosa Ave
- LOT 26 Mimosa Ave
- LOT 21 Mimosa Ave
- LOT 18 Mimosa Ave
- LOT 17 Mimosa Ave
- LOT 16 Mimosa Ave
- LOT 24 Mimosa Ave
- LOT 22 Mimosa Ave
- LOT 23 Mimosa Ave
- LOT 27 Mimosa Ave
- LOT 19 Mimosa Ave
- 1837 Anglo St
- 4024 Mimosa St
- 1853 Carl Ave
- 1853 Carl Ave
- 3945 Mimosa St
- 1856 Anglo St
- 1825 Anglo St