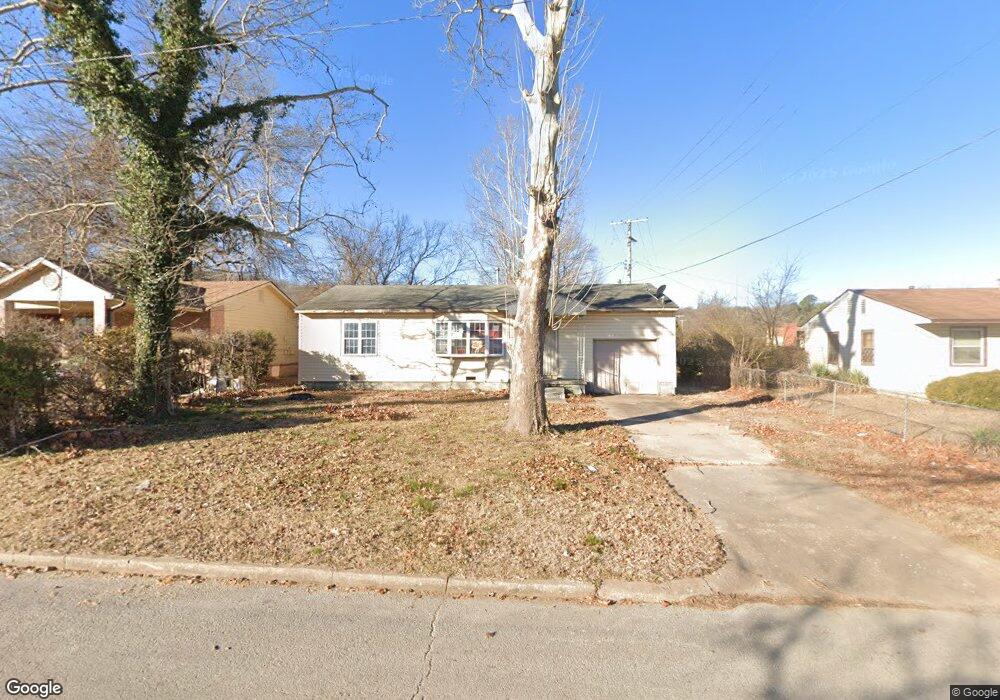
4012 N Garrison Ave Tulsa, OK 74106
Walt Whitman NeighborhoodEstimated Value: $70,551 - $134,000
--
Bed
1
Bath
832
Sq Ft
$119/Sq Ft
Est. Value
About This Home
This home is located at 4012 N Garrison Ave, Tulsa, OK 74106 and is currently estimated at $98,888, approximately $118 per square foot. 4012 N Garrison Ave is a home located in Tulsa County with nearby schools including Whitman Elementary School, Monroe Demonstration Academy, and McLain High School of Science and Technology.
Ownership History
Date
Name
Owned For
Owner Type
Purchase Details
Closed on
Mar 6, 2025
Sold by
Moreira Elvin
Bought by
Sb Home Buyers
Current Estimated Value
Purchase Details
Closed on
Sep 26, 2022
Sold by
Gay Eula
Bought by
Moreira Elvin
Purchase Details
Closed on
Feb 8, 2022
Sold by
John Haney
Bought by
Moeira Elvin
Purchase Details
Closed on
Dec 12, 2021
Sold by
Thomas Cecilia
Bought by
Haney John
Purchase Details
Closed on
Jul 28, 2021
Sold by
John Haney
Bought by
Khan Kazim
Purchase Details
Closed on
Sep 6, 2019
Sold by
Terrell Michelle
Bought by
Thomas Cecilia
Purchase Details
Closed on
Mar 13, 2018
Sold by
Thomas Cecelia
Bought by
Terrell Michelle
Purchase Details
Closed on
Nov 5, 2009
Sold by
Thomas Mitchell and Thomas Cecelia
Bought by
Thomas Mitchell and Thomas Cecelia
Purchase Details
Closed on
Oct 20, 2008
Sold by
Thomas Mitchell and Thomas Cecelia
Bought by
Thomas Mitchell and Thomas Cecelia
Create a Home Valuation Report for This Property
The Home Valuation Report is an in-depth analysis detailing your home's value as well as a comparison with similar homes in the area
Home Values in the Area
Average Home Value in this Area
Purchase History
| Date | Buyer | Sale Price | Title Company |
|---|---|---|---|
| Sb Home Buyers | -- | None Listed On Document | |
| Moreira Elvin | -- | -- | |
| Moeira Elvin | $500 | None Listed On Document | |
| Haney John | $500 | None Available | |
| Khan Kazim | -- | None Listed On Document | |
| Thomas Cecilia | -- | None Available | |
| Terrell Michelle | -- | None Available | |
| Thomas Cecelia | -- | None Available | |
| Thomas Mitchell | -- | None Available | |
| Thomas Mitchell | -- | Tulsa Abstract & Title Co |
Source: Public Records
Tax History Compared to Growth
Tax History
| Year | Tax Paid | Tax Assessment Tax Assessment Total Assessment is a certain percentage of the fair market value that is determined by local assessors to be the total taxable value of land and additions on the property. | Land | Improvement |
|---|---|---|---|---|
| 2024 | $668 | $5,525 | $994 | $4,531 |
| 2023 | $668 | $5,262 | $1,089 | $4,173 |
| 2022 | $610 | $4,576 | $1,089 | $3,487 |
| 2021 | $609 | $4,609 | $1,089 | $3,520 |
| 2020 | $600 | $4,609 | $1,089 | $3,520 |
| 2019 | $611 | $4,456 | $1,053 | $3,403 |
| 2018 | $446 | $3,244 | $767 | $2,477 |
| 2017 | $428 | $4,121 | $974 | $3,147 |
| 2016 | $403 | $4,000 | $945 | $3,055 |
| 2015 | $388 | $4,609 | $1,089 | $3,520 |
| 2014 | $369 | $4,609 | $1,089 | $3,520 |
Source: Public Records
Map
Nearby Homes
- 502 E 40th St N
- 3748 N Hartford Ave
- 3905 N Elgin Ave
- 3784 N Lansing Place
- 3538 N Hartford Ave
- 4338 N Hartford Ave
- 4338 N Iroquois Ave
- 4346 N Frankfort Place
- 771 E 43rd St N
- 224 E 44th St N
- 2806 N Lansing Place
- 26 E 45th St N
- 4604 N Boston Place
- 3149 N Hartford Ave
- 4707 N Elgin Ave
- 3125 N Hartford Ave
- 3129 N Lansing Place
- 509 E 48th Place N
- 1110 E 49th St N
- 303 W 46th Place N
- 4006 N Garrison Ave
- 4018 N Garrison Ave
- 575 E 40th St N
- 578 E 40th Place N
- 571 E 40th St N
- 572 E 40th Place N
- 4015 N Garrison Ave
- 4011 N Garrison Ave
- 4005 N Garrison Ave
- 568 E 40th Place N
- 567 E 40th St N
- 4001 N Garrison Ave
- 3938 N Garrison Ave
- 578 E 40th St N
- 4021 N Garrison Ave
- 581 E 40th Place N
- 578 E 40th St N
- 3939 N Garrison Ave
- 582 E 40th St N
- 575 E 40th Place N