Estimated Value: $508,110 - $579,000
3
Beds
3
Baths
2,913
Sq Ft
$189/Sq Ft
Est. Value
About This Home
This home is located at 4012 Shadowind Way, Gotha, FL 34734 and is currently estimated at $550,028, approximately $188 per square foot. 4012 Shadowind Way is a home located in Orange County with nearby schools including Thornebrooke Elementary School, Gotha Middle School, and Olympia High.
Ownership History
Date
Name
Owned For
Owner Type
Purchase Details
Closed on
Feb 27, 2015
Sold by
Gravrock Kristianne A
Bought by
Rizzo Edward and Edward Rizzo Revocable Trust
Current Estimated Value
Purchase Details
Closed on
Jun 25, 2009
Sold by
Morrow Margaret B
Bought by
Gravrock Kristianne A
Home Financials for this Owner
Home Financials are based on the most recent Mortgage that was taken out on this home.
Original Mortgage
$175,000
Interest Rate
4.79%
Mortgage Type
Purchase Money Mortgage
Purchase Details
Closed on
Aug 23, 2001
Sold by
Jorge Bryson I
Bought by
Morrow Margaret B
Purchase Details
Closed on
Oct 6, 1999
Sold by
Luscian Hills Development Limited Part
Bought by
Morrow Margaret B and Bryson Jorge A
Home Financials for this Owner
Home Financials are based on the most recent Mortgage that was taken out on this home.
Original Mortgage
$106,000
Interest Rate
7.79%
Mortgage Type
New Conventional
Create a Home Valuation Report for This Property
The Home Valuation Report is an in-depth analysis detailing your home's value as well as a comparison with similar homes in the area
Home Values in the Area
Average Home Value in this Area
Purchase History
| Date | Buyer | Sale Price | Title Company |
|---|---|---|---|
| Rizzo Edward | $254,200 | None Available | |
| Gravrock Kristianne A | $235,000 | Attorney | |
| Morrow Margaret B | $52,000 | -- | |
| Morrow Margaret B | $178,400 | -- |
Source: Public Records
Mortgage History
| Date | Status | Borrower | Loan Amount |
|---|---|---|---|
| Previous Owner | Gravrock Kristianne A | $175,000 | |
| Previous Owner | Morrow Margaret B | $106,000 |
Source: Public Records
Tax History
| Year | Tax Paid | Tax Assessment Tax Assessment Total Assessment is a certain percentage of the fair market value that is determined by local assessors to be the total taxable value of land and additions on the property. | Land | Improvement |
|---|---|---|---|---|
| 2025 | $4,020 | $278,314 | -- | -- |
| 2024 | $3,545 | $270,470 | -- | -- |
| 2023 | $3,545 | $255,191 | $0 | $0 |
| 2022 | $3,482 | $247,758 | $0 | $0 |
| 2021 | $3,424 | $240,542 | $0 | $0 |
| 2020 | $4,337 | $268,013 | $75,000 | $193,013 |
| 2019 | $4,356 | $254,559 | $60,000 | $194,559 |
| 2018 | $4,244 | $244,561 | $55,000 | $189,561 |
| 2017 | $4,305 | $252,088 | $50,000 | $202,088 |
| 2016 | $3,917 | $219,226 | $40,000 | $179,226 |
| 2015 | $3,779 | $211,852 | $40,000 | $171,852 |
| 2014 | $3,526 | $190,835 | $36,000 | $154,835 |
Source: Public Records
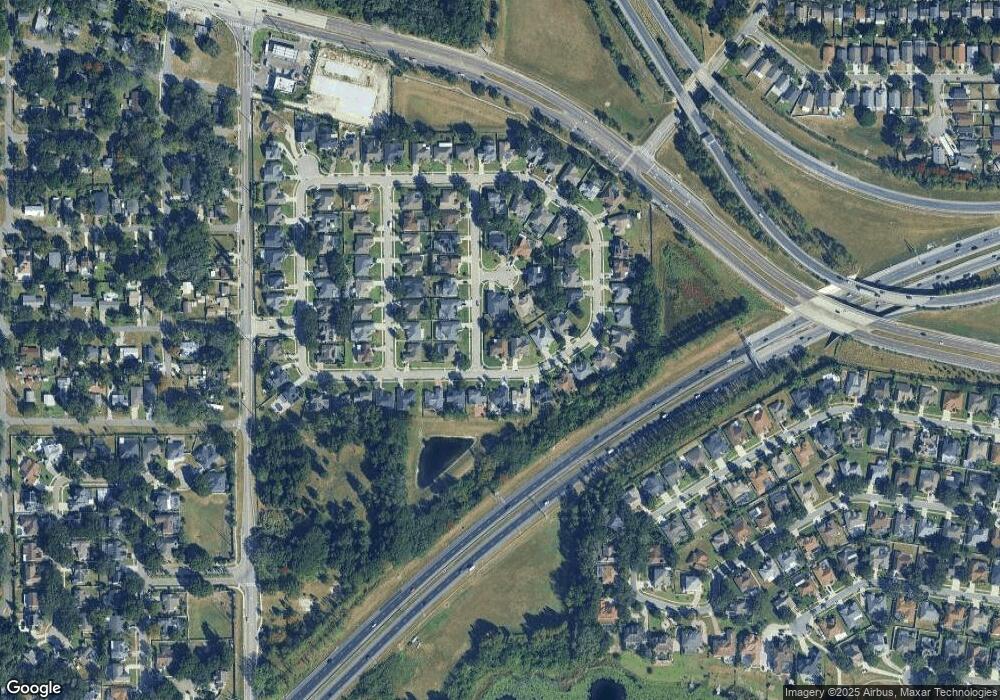
Map
Nearby Homes
- 1658 Hempel Ave
- 9101 Lake Coventry Ct
- 9126 Lake Coventry Ct
- 3625 Pompano Ct
- 3607 Breeders Cup Ct
- 9467 Lake Lotta Cir
- 1707 Twin Lake Dr
- 1882 Lake Pearl Dr
- 3321 Furlong Way
- 970 Davenwood Ct
- 935 Davenwood Ct
- 946 Davenwood Ct
- 537 Woodlawn Cemetery Rd
- 1101 Vintage Village Ln Unit 101
- 1101 Vintage Village Ln Unit 103
- 608 Bridge Creek Blvd
- 1990 Erving Cir Unit 108
- 1990 Erving Cir Unit 101
- 2000 Erving Cir Unit 102
- 2015 Erving Cir Unit 307
- 4006 Shadowind Way
- 3900 Ballinore Place
- 1644 Cerulean Way
- 3992 Shadowind Way
- 1638 Cerulean Way
- 4011 Shadowind Way
- 3906 Ballinore Place
- 4017 Shadowind Way
- 4005 Shadowind Way
- 1632 Cerulean Way
- 4023 Shadowind Way
- 3999 Shadowind Way
- 3980 Shadowind Way
- 1626 Cerulean Way
- 3993 Shadowind Way
- 3912 Ballinore Place
- 4029 Shadowind Way
- 1643 Shonnora Dr
- 1637 Shonnora Dr
- 3987 Shadowind Way
Your Personal Tour Guide
Ask me questions while you tour the home.