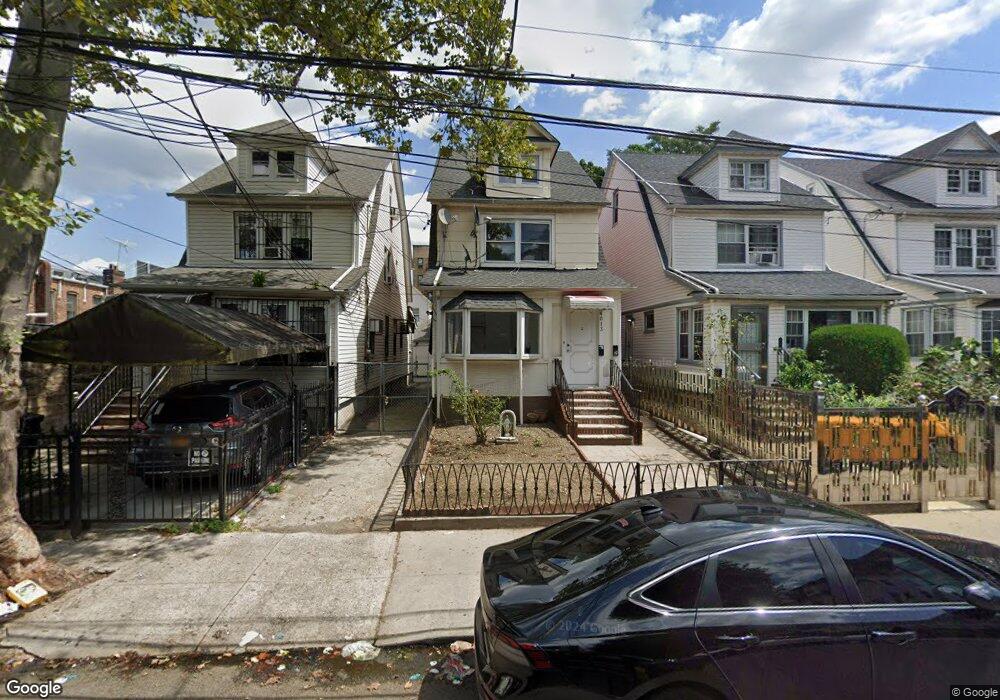
4013 80th St Elmhurst, NY 11373
Elmhurst NeighborhoodEstimated Value: $1,227,058 - $1,338,000
--
Bed
--
Bath
1,844
Sq Ft
$689/Sq Ft
Est. Value
About This Home
This home is located at 4013 80th St, Elmhurst, NY 11373 and is currently estimated at $1,271,265, approximately $689 per square foot. 4013 80th St is a home located in Queens County with nearby schools including P.S. 89 Elmhurst, Is 5 The Walter Crowley Intermediate School, and Newtown High School.
Ownership History
Date
Name
Owned For
Owner Type
Purchase Details
Closed on
Oct 3, 2024
Sold by
Damianou Carlina
Bought by
Chan Wallace Peter and Wu Winston Tian
Current Estimated Value
Home Financials for this Owner
Home Financials are based on the most recent Mortgage that was taken out on this home.
Original Mortgage
$798,000
Outstanding Balance
$788,032
Interest Rate
6.35%
Mortgage Type
Purchase Money Mortgage
Estimated Equity
$483,233
Purchase Details
Closed on
Dec 19, 2002
Sold by
Hernandez John A
Bought by
Damianou Carlina
Purchase Details
Closed on
Jul 24, 1996
Sold by
Calderon Eduardo
Bought by
Hernandez John A
Home Financials for this Owner
Home Financials are based on the most recent Mortgage that was taken out on this home.
Original Mortgage
$163,600
Interest Rate
8.4%
Mortgage Type
FHA
Create a Home Valuation Report for This Property
The Home Valuation Report is an in-depth analysis detailing your home's value as well as a comparison with similar homes in the area
Home Values in the Area
Average Home Value in this Area
Purchase History
| Date | Buyer | Sale Price | Title Company |
|---|---|---|---|
| Chan Wallace Peter | $1,140,000 | -- | |
| Chan Wallace Peter | $1,140,000 | -- | |
| Damianou Carlina | $465,000 | -- | |
| Damianou Carlina | $465,000 | -- | |
| Hernandez John A | $165,000 | Lawyers Title Insurance Corp | |
| Hernandez John A | $165,000 | Lawyers Title Insurance Corp |
Source: Public Records
Mortgage History
| Date | Status | Borrower | Loan Amount |
|---|---|---|---|
| Open | Chan Wallace Peter | $798,000 | |
| Closed | Chan Wallace Peter | $798,000 | |
| Previous Owner | Hernandez John A | $163,600 | |
| Closed | Damianou Carlina | $0 |
Source: Public Records
Tax History Compared to Growth
Tax History
| Year | Tax Paid | Tax Assessment Tax Assessment Total Assessment is a certain percentage of the fair market value that is determined by local assessors to be the total taxable value of land and additions on the property. | Land | Improvement |
|---|---|---|---|---|
| 2025 | $8,503 | $44,876 | $11,704 | $33,172 |
| 2024 | $8,503 | $42,336 | $13,225 | $29,111 |
| 2023 | $8,503 | $42,336 | $11,531 | $30,805 |
| 2022 | $8,154 | $62,040 | $20,280 | $41,760 |
| 2021 | $8,342 | $62,220 | $20,280 | $41,940 |
| 2020 | $7,916 | $61,500 | $20,280 | $41,220 |
| 2019 | $7,380 | $57,660 | $20,280 | $37,380 |
| 2018 | $7,192 | $35,280 | $12,106 | $23,174 |
| 2017 | $6,939 | $34,038 | $12,384 | $21,654 |
| 2016 | $6,604 | $34,038 | $12,384 | $21,654 |
| 2015 | $3,873 | $31,164 | $19,928 | $11,236 |
| 2014 | $3,873 | $29,400 | $22,560 | $6,840 |
Source: Public Records
Map
Nearby Homes
- 40-29 81st St
- 81-09 41st Ave Unit 5B
- 8114 Baxter Ave Unit 1E
- 40-05 Ithaca St Unit 6D
- 37-58 79th St
- 40-18 Hampton St Unit 6-D
- 40-35 Ithaca St Unit 3D
- 42-22 Ketcham St Unit 10E
- 42-22 Ketcham St Unit D9
- 4035 Ithaca St Unit 6F
- 4035 Ithaca St Unit 1C
- 4035 Ithaca St Unit 5B
- 4222 Ketcham St Unit F16
- 37-28 80th St Unit 32
- 37-28 80th St Unit 22
- 37-21 80th St Unit 3
- 37-21 80th St Unit 6K
- 37-21 80th St Unit 1
- 37-21 80th St Unit 4H
- 37-21 80th St Unit 4
- 4015 80th St
- 4011 80th St
- 4017 80th St
- 4019 80th St
- 8006 Roosevelt Ave
- 8008 Roosevelt Ave
- 8004 Roosevelt Ave
- 4014 81st St
- 8002 Roosevelt Ave
- 8002 Roosevelt Ave
- 4016 81st St
- 4012 81st St
- 8012 Roosevelt Ave
- 80-6 Roosevelt Ave
- 4018 81st St
- 8014 Roosevelt Ave
- 8010 Roosevelt Ave
- 4020 81st St
- 80-12 Roosevelt Ave Unit 1Fl
- 80-12 Roosevelt Ave