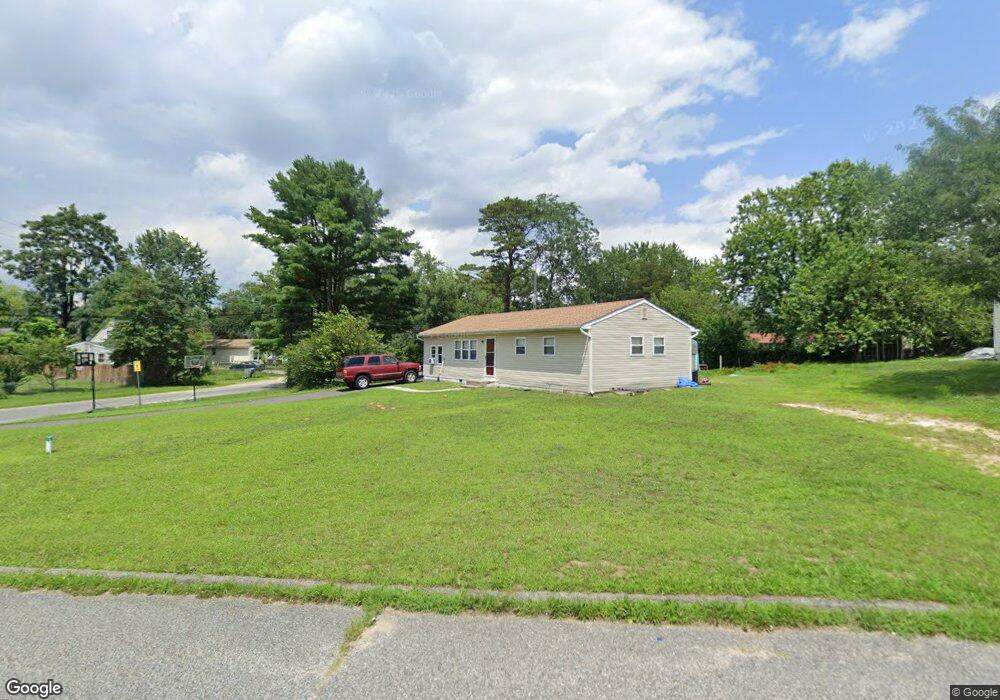
4013 E Adams Cir Hammonton, NJ 08037
Estimated Value: $242,000 - $373,000
4
Beds
1
Bath
1,078
Sq Ft
$268/Sq Ft
Est. Value
About This Home
This home is located at 4013 E Adams Cir, Hammonton, NJ 08037 and is currently estimated at $288,748, approximately $267 per square foot. 4013 E Adams Cir is a home located in Atlantic County with nearby schools including Mullica Township Primary School, Mullica Township Elementary & Middle School, and Cedar Creek High School.
Ownership History
Date
Name
Owned For
Owner Type
Purchase Details
Closed on
Nov 12, 2018
Sold by
The United States Of America
Bought by
Ponchs Property Development Llc
Current Estimated Value
Purchase Details
Closed on
Sep 26, 2017
Sold by
Ceasar Claudia M
Bought by
United States Of America
Purchase Details
Closed on
Jun 13, 2005
Sold by
Bermudez Felix F
Bought by
Ceasar Claudia M
Home Financials for this Owner
Home Financials are based on the most recent Mortgage that was taken out on this home.
Original Mortgage
$152,000
Interest Rate
5.82%
Mortgage Type
Stand Alone First
Purchase Details
Closed on
Jan 29, 1999
Sold by
Didonato Stephen M
Bought by
Bermudez Felix F
Home Financials for this Owner
Home Financials are based on the most recent Mortgage that was taken out on this home.
Original Mortgage
$60,800
Interest Rate
6.74%
Mortgage Type
Purchase Money Mortgage
Create a Home Valuation Report for This Property
The Home Valuation Report is an in-depth analysis detailing your home's value as well as a comparison with similar homes in the area
Home Values in the Area
Average Home Value in this Area
Purchase History
| Date | Buyer | Sale Price | Title Company |
|---|---|---|---|
| Ponchs Property Development Llc | $20,750 | Foundation Title Llc | |
| United States Of America | -- | None Available | |
| Ceasar Claudia M | $152,000 | Surety Title Agency Of Atlan | |
| Bermudez Felix F | $64,000 | Landis Title Corporation |
Source: Public Records
Mortgage History
| Date | Status | Borrower | Loan Amount |
|---|---|---|---|
| Previous Owner | Ceasar Claudia M | $152,000 | |
| Previous Owner | Bermudez Felix F | $60,800 |
Source: Public Records
Tax History Compared to Growth
Tax History
| Year | Tax Paid | Tax Assessment Tax Assessment Total Assessment is a certain percentage of the fair market value that is determined by local assessors to be the total taxable value of land and additions on the property. | Land | Improvement |
|---|---|---|---|---|
| 2025 | $3,109 | $86,400 | $22,800 | $63,600 |
| 2024 | $3,109 | $86,400 | $22,800 | $63,600 |
| 2023 | $2,947 | $86,400 | $22,800 | $63,600 |
| 2022 | $2,947 | $86,400 | $22,800 | $63,600 |
| 2021 | $2,830 | $86,400 | $22,800 | $63,600 |
| 2020 | $2,690 | $84,300 | $22,800 | $61,500 |
| 2019 | $2,636 | $84,300 | $22,800 | $61,500 |
| 2018 | $3,007 | $64,000 | $17,300 | $46,700 |
| 2017 | $3,004 | $64,000 | $17,300 | $46,700 |
| 2016 | $2,827 | $64,000 | $17,300 | $46,700 |
| 2015 | $2,686 | $64,000 | $17,300 | $46,700 |
| 2014 | $2,655 | $64,000 | $17,300 | $46,700 |
Source: Public Records
Map
Nearby Homes
- 4160 Anna Dr
- 4166 Anna Dr
- 4179 E Adams Cir
- 541 Wharton Park Blvd
- 547 Wharton Park Blvd
- 551 Wharton Park Blvd
- 4075 W Adams Cir
- 4501 S White Horse Pike
- 1021 Reading Ave
- 900 Elwood Rd
- 900 Elwood Rd Unit MULLICA TWP
- 4640 Frazier Ave
- 0 Columbia Rd Unit NJAC2012962
- 0 Columbia Rd Unit 586593
- 154 24th Ave
- 700 Columbia Rd
- 4834 White Horse Pike
- 4821 Moss Mill Rd
- 4930 Moss Mill Rd
- 3142 Moss Mill Rd
- 431 Arch Ln
- 4011 E Adams Cir
- 4007 E Adams Cir
- 4012 E Adams Cir
- 4019 W Adams Cir
- 4145 Anna Dr
- 4010 E Adams Cir
- 430 Arch Ln
- 4149 Anna Dr
- 4006 E Adams Cir
- 4006 W Adams Cir
- 4018 W Adams Cir
- 4153 Anna Dr
- 4005 E Adams Cir
- 4137 Anna Dr
- 4025 W Adams Cir
- 4022 W Adams Cir
- 4004 E Adams Cir
- 4157 Anna Dr
- 4135 Anna Dr