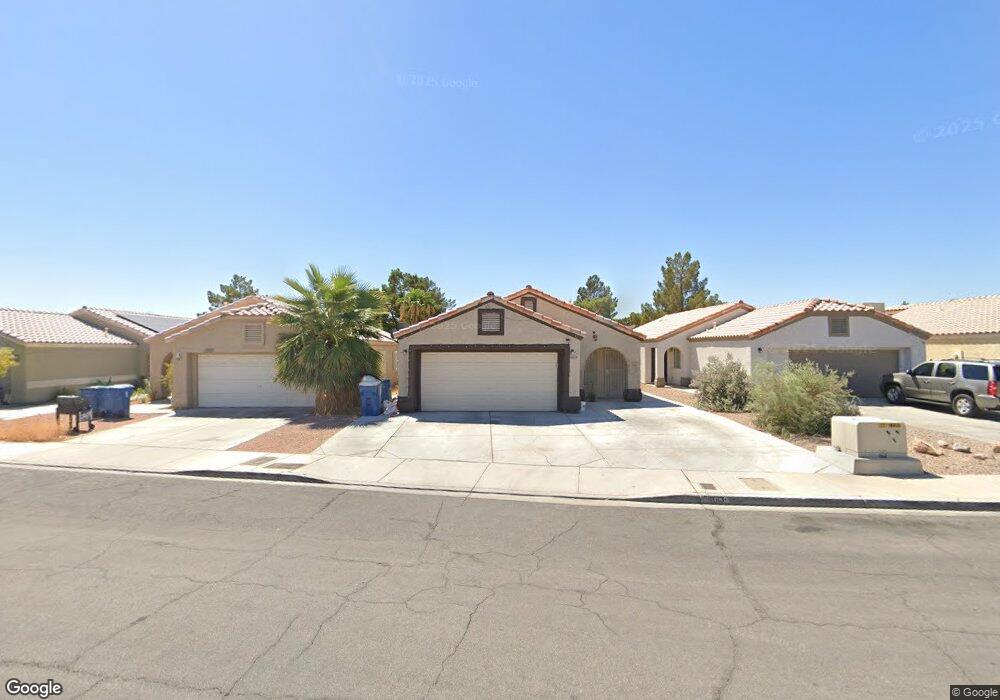
4013 Hidden Oasis Ct Unit 4 Las Vegas, NV 89110
East Las Vegas NeighborhoodEstimated Value: $346,675 - $366,000
3
Beds
2
Baths
1,240
Sq Ft
$287/Sq Ft
Est. Value
About This Home
This home is located at 4013 Hidden Oasis Ct Unit 4, Las Vegas, NV 89110 and is currently estimated at $355,669, approximately $286 per square foot. 4013 Hidden Oasis Ct Unit 4 is a home located in Clark County with nearby schools including William K. Moore Elementary School, Dell H Robison Middle School, and Desert Pines High School.
Ownership History
Date
Name
Owned For
Owner Type
Purchase Details
Closed on
Aug 3, 2011
Sold by
Gomez Tony
Bought by
4013 Hidden Oasis Ct Trust
Current Estimated Value
Purchase Details
Closed on
Dec 28, 2010
Sold by
Fannie Mae
Bought by
Gomez Tony
Purchase Details
Closed on
Sep 23, 2010
Sold by
Rithiphon Sawad and Yartprachum Sanit
Bought by
Federal National Mortgage Association
Purchase Details
Closed on
Jan 8, 1996
Sold by
Viking Construction Inc
Bought by
Rithiphon Sawad and Yartprachum Sanit
Home Financials for this Owner
Home Financials are based on the most recent Mortgage that was taken out on this home.
Original Mortgage
$92,900
Interest Rate
7.38%
Create a Home Valuation Report for This Property
The Home Valuation Report is an in-depth analysis detailing your home's value as well as a comparison with similar homes in the area
Home Values in the Area
Average Home Value in this Area
Purchase History
| Date | Buyer | Sale Price | Title Company |
|---|---|---|---|
| 4013 Hidden Oasis Ct Trust | -- | None Available | |
| Gomez Tony | $72,000 | Stewart Title Las Vegas War | |
| Federal National Mortgage Association | $157,103 | Accommodation | |
| Rithiphon Sawad | $98,000 | Land Title |
Source: Public Records
Mortgage History
| Date | Status | Borrower | Loan Amount |
|---|---|---|---|
| Previous Owner | Rithiphon Sawad | $92,900 |
Source: Public Records
Tax History Compared to Growth
Tax History
| Year | Tax Paid | Tax Assessment Tax Assessment Total Assessment is a certain percentage of the fair market value that is determined by local assessors to be the total taxable value of land and additions on the property. | Land | Improvement |
|---|---|---|---|---|
| 2025 | $932 | $67,037 | $22,050 | $44,987 |
| 2024 | $906 | $67,037 | $22,050 | $44,987 |
| 2023 | $950 | $67,654 | $24,850 | $42,804 |
| 2022 | $922 | $60,547 | $21,350 | $39,197 |
| 2021 | $854 | $55,901 | $18,550 | $37,351 |
| 2020 | $826 | $54,684 | $17,500 | $37,184 |
| 2019 | $816 | $50,729 | $14,000 | $36,729 |
| 2018 | $779 | $43,390 | $11,550 | $31,840 |
| 2017 | $1,496 | $45,646 | $9,800 | $35,846 |
| 2016 | $739 | $37,540 | $7,000 | $30,540 |
| 2015 | $738 | $41,580 | $5,600 | $35,980 |
| 2014 | $715 | $21,145 | $4,200 | $16,945 |
Source: Public Records
Map
Nearby Homes
- 653 Lineshack Ln
- 1405 N Sandhill Rd Unit 2
- 951 N Sandhill Rd
- 3916 Logging Ct
- 3933 Harris Ave
- 4224 Estaban Ct
- 4028 Lighthouse Ave
- 4117 Lighthouse Ave
- 3620 Park Oliver Dr
- 908 Villa Inn Ct
- 4100 Montebello Ave
- 4108 Montebello Ave
- 3908 Montebello Ave
- 432 Anchor St
- 833 Hedge Way Unit 2
- 917 Snug Harbor St
- 825 N Lamb Blvd Unit 65
- 825 N Lamb Blvd Unit 186
- 825 N Lamb Blvd Unit 335
- 825 N Lamb Blvd Unit 310
- 4009 Hidden Oasis Ct
- 4017 Hidden Oasis Ct
- 4005 Hidden Oasis Ct
- 4021 Hidden Oasis Ct
- 4025 Hidden Oasis Ct
- 4001 Hidden Oasis Ct
- 4012 Hidden Oasis Ct
- 4016 Hidden Oasis Ct
- 4020 Hidden Oasis Ct
- 4008 Hidden Oasis Ct
- 4033 Hidden Oasis Ct
- 4024 Hidden Oasis Ct
- 4004 Hidden Oasis Ct
- 4028 Hidden Oasis Ct
- 4000 Hidden Oasis Ct
- 4037 Hidden Oasis Ct
- 4032 Hidden Oasis Ct
- 720 Grande Ronde Ct
- 721 Grande Ronde Ct