
Landlord's Agent in 2014
Michelle Graves
Ansley Developer Services, LLC
(678) 858-8461
106 Total Sales
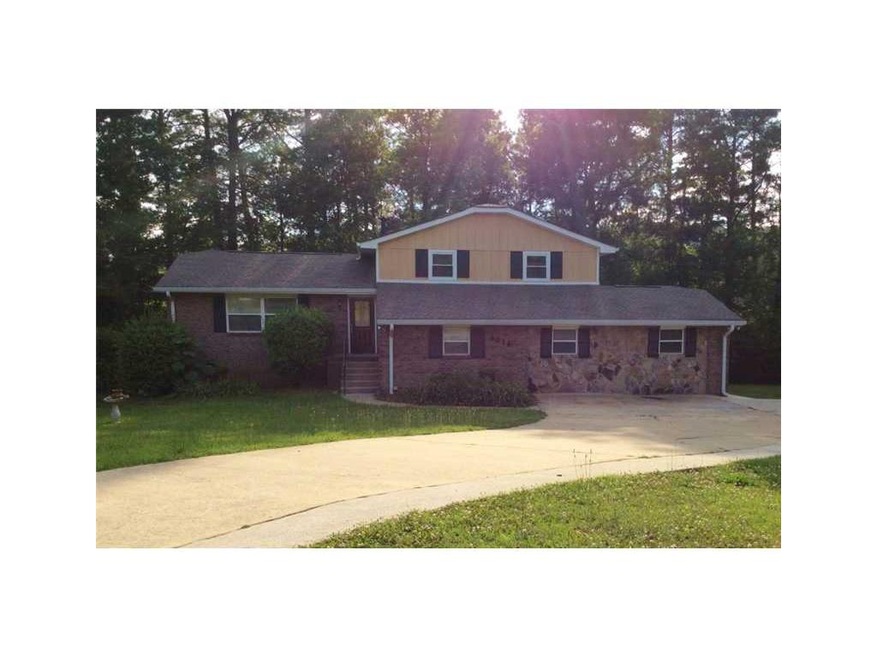
Estimated Value: $265,000 - $300,000
Newly renovated large home in fine, established neighborhood, surrounded by large homes on large homesites. Home is located in a cul-de-sac and backs up to a beautiful and tranquil lake. This home has many custom features including stone accents, huge finished basement, and natural wood finishes. Gorgeous updated kitchen with new stainless steel appliances. Bonus room with a wall of built-in shelving and cabinetry. All credit types considered.
Last Agent to Rent the Property
Ansley Developer Services, LLC Listed on: 06/01/2014
Last Renter's Agent
NON-MLS NMLS
Non FMLS Member
| Date | Buyer | Sale Price | Title Company |
|---|---|---|---|
| Fkh Sfr Propco D L P | $19,567,768 | -- | |
| Rntr 3 Llc | $98,000 | -- | |
| Gardner Delecia | $4,449 | -- | |
| Pineda Jose Mario Aguinada | $38,000 | -- | |
| Skylight Investments Llc | $26,000 | -- | |
| Global Source Investments Rela | $18,000 | -- | |
| Dekalb County | $2,163 | -- | |
| Gardner Norman L | -- | -- |
| Date | Event | Price | List to Sale | Price per Sq Ft |
|---|---|---|---|---|
| 06/01/2014 06/01/14 | Rented | $1,200 | 0.0% | -- |
| 06/01/2014 06/01/14 | For Rent | $1,200 | -- | -- |
| Year | Tax Paid | Tax Assessment Tax Assessment Total Assessment is a certain percentage of the fair market value that is determined by local assessors to be the total taxable value of land and additions on the property. | Land | Improvement |
|---|---|---|---|---|
| 2025 | $5,238 | $109,680 | $13,162 | $96,518 |
| 2024 | $5,237 | $109,680 | $13,162 | $96,518 |
| 2023 | $5,237 | $109,680 | $13,440 | $96,240 |
| 2022 | $4,603 | $97,240 | $8,960 | $88,280 |
| 2021 | $2,298 | $44,720 | $8,960 | $35,760 |
| 2020 | $1,877 | $35,120 | $8,960 | $26,160 |
| 2019 | $1,807 | $33,520 | $4,320 | $29,200 |
| 2018 | $1,095 | $17,000 | $4,320 | $12,680 |
| 2017 | $1,401 | $24,160 | $4,320 | $19,840 |
| 2016 | $1,283 | $21,440 | $4,320 | $17,120 |
| 2014 | $1,024 | $15,196 | $2,236 | $12,960 |
Landlord's Agent in 2014
Michelle Graves
Ansley Developer Services, LLC
(678) 858-8461
106 Total Sales
N
Tenant's Agent in 2014
NON-MLS NMLS
Non FMLS Member
Source: First Multiple Listing Service (FMLS)
MLS Number: 5298237
APN: 15-043-02-073
![]() Listings identified with the FMLS IDX logo come from FMLS and are held by brokerage firms other than the owner of this website. The listing brokerage is identified in any listing details. Information is deemed reliable but is not guaranteed. If you believe any FMLS listing contains material that infringes your copyrighted work please visit www.fmls.com/dmca to review our DMCA policy and learn how to submit a takedown request. © 2025 First Multiple Listing Service, Inc.
Listings identified with the FMLS IDX logo come from FMLS and are held by brokerage firms other than the owner of this website. The listing brokerage is identified in any listing details. Information is deemed reliable but is not guaranteed. If you believe any FMLS listing contains material that infringes your copyrighted work please visit www.fmls.com/dmca to review our DMCA policy and learn how to submit a takedown request. © 2025 First Multiple Listing Service, Inc.
Disclaimer: Certain information contained herein is derived from information provided by parties other than Homes.com. All information provided is deemed reliable, but is not guaranteed to be accurate and should be independently verified.